Nonmanufacturing activity in the region declined this month, according to the firms responding to the March Nonmanufacturing Business Outlook Survey. The index for general activity at the firm level turned negative. The new orders index remained negative, while the sales/revenues index fell to a near-zero reading. The full-time employment index suggests less widespread increases in employment. Both price indexes continued to indicate overall increases in prices. The firms continue to expect growth over the next six months at their own firms and in the region.
Most Current Indicators Weaken
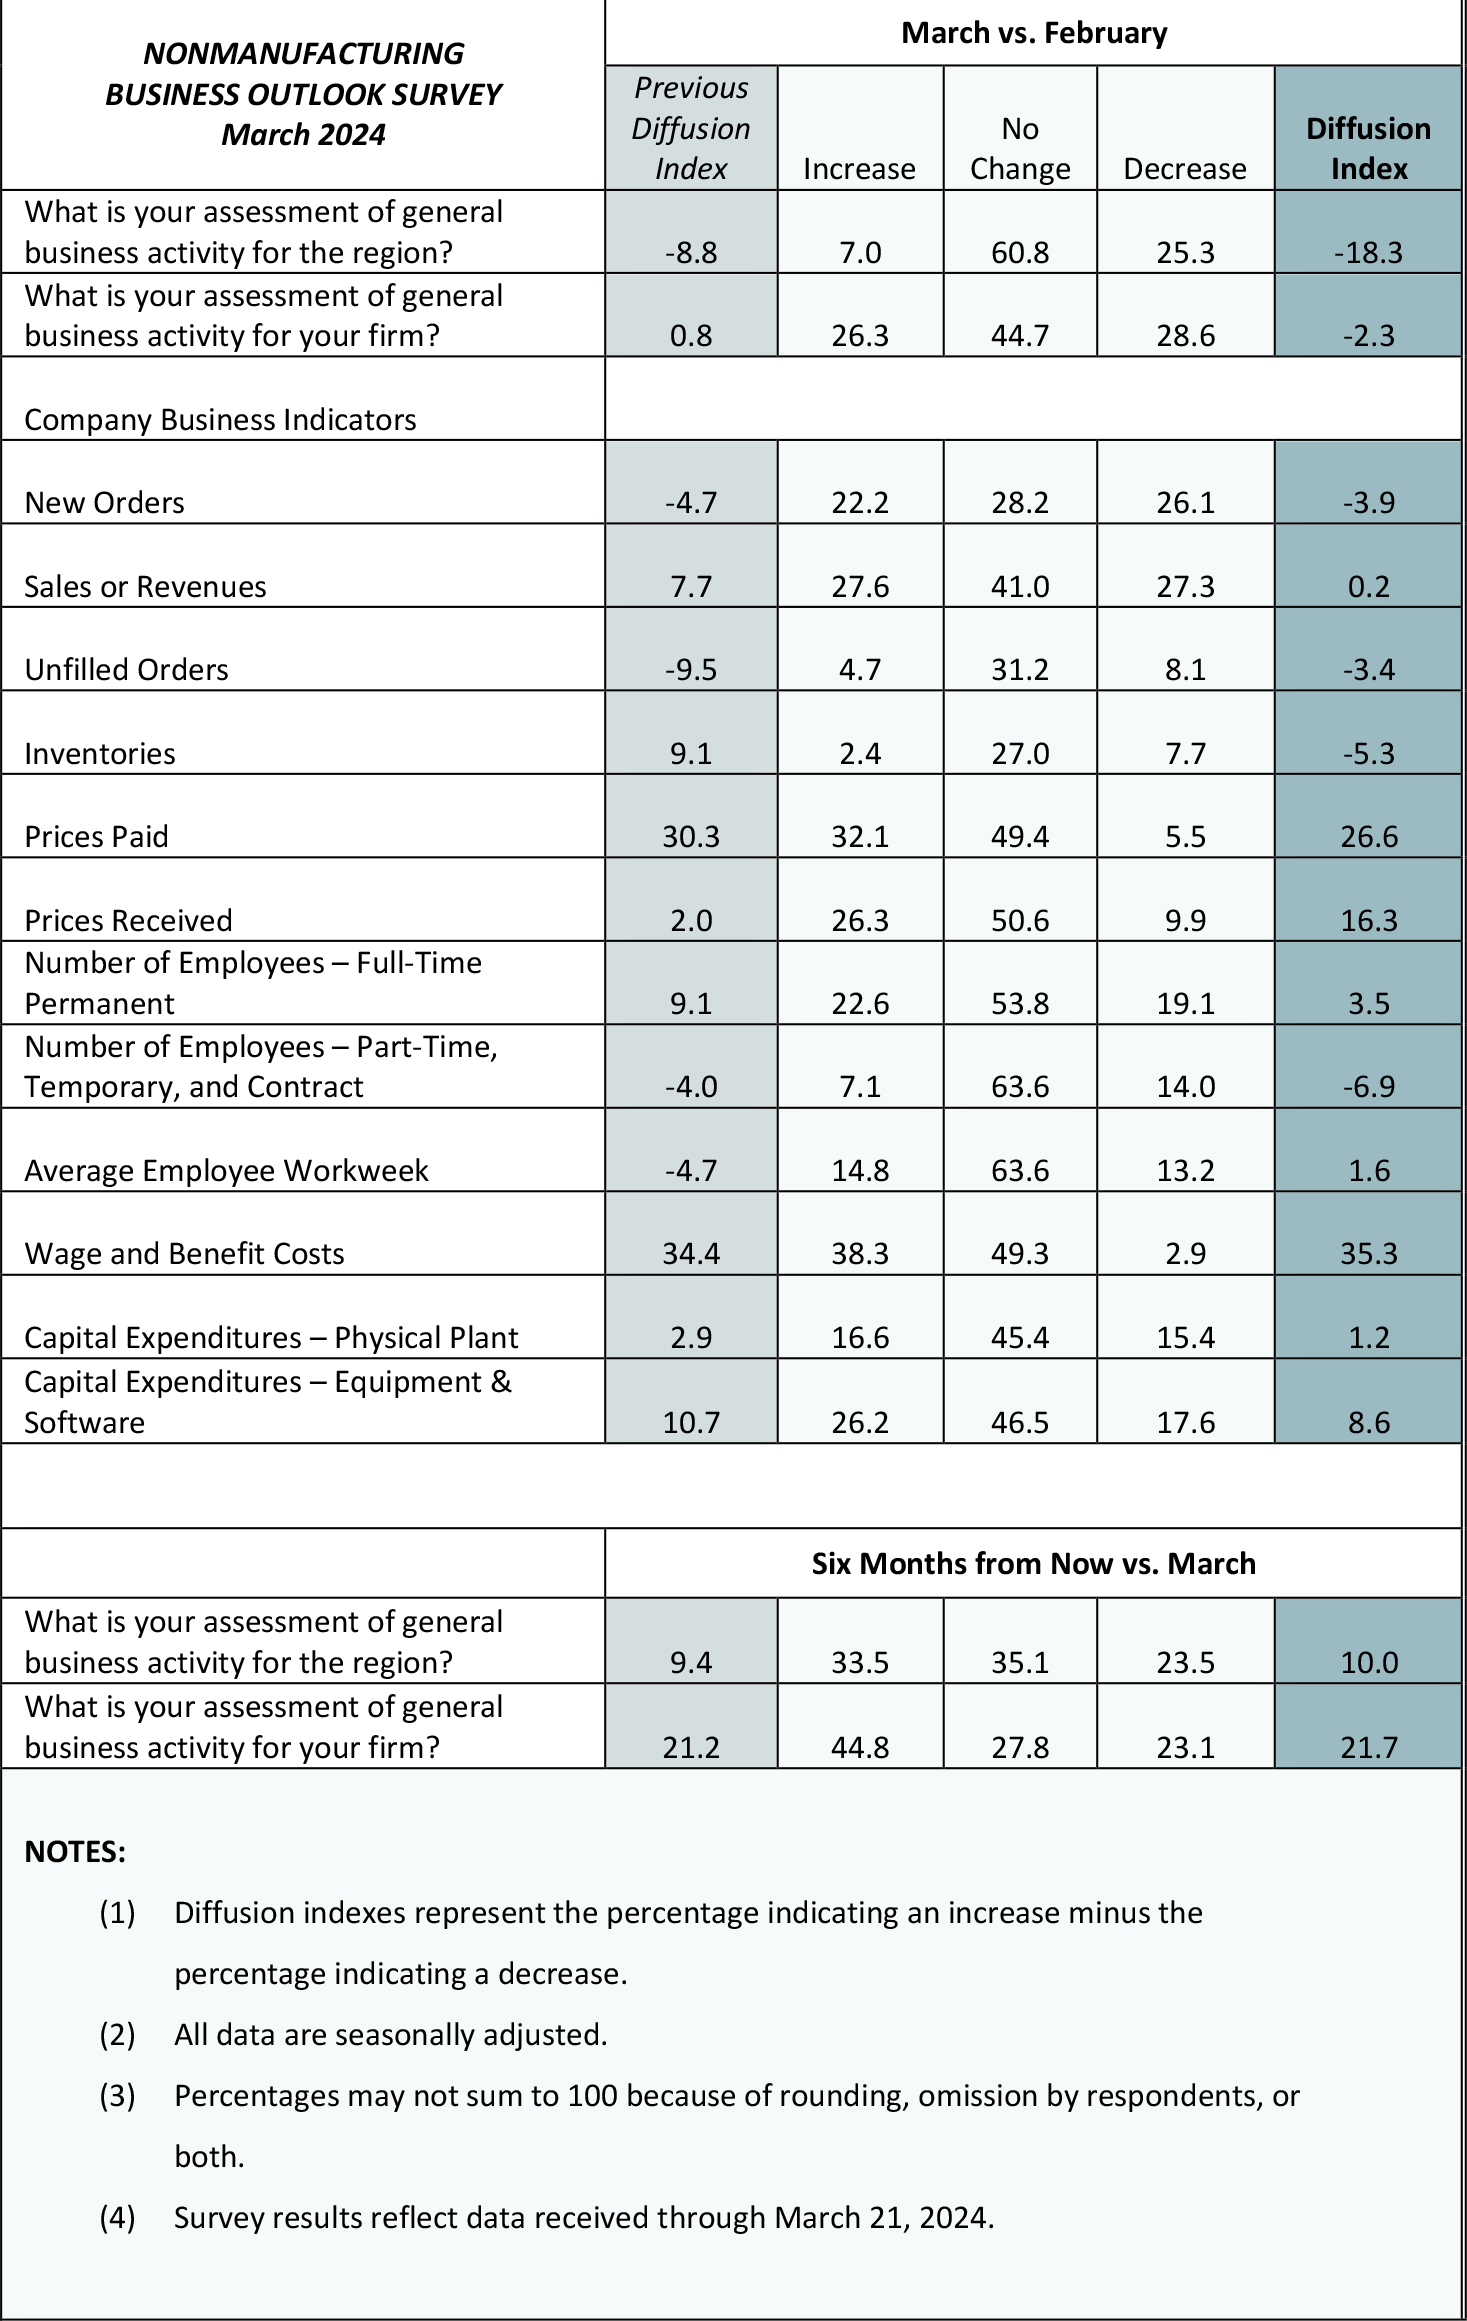
The diffusion index for current general activity at the firm level turned negative, falling from a reading of 0.8 in February to -2.3 this month (see Chart 1). This is the index's first negative reading since October. Almost 29 percent of the firms reported decreases, while 26 percent reported increases; 45 percent reported no change in activity. The new orders index remained negative but edged up from -4.7 to -3.9, its 12th negative reading in the past 13 months. More than 26 percent of the firms reported decreases in new orders, while 22 percent reported increases. The sales/revenues index dropped 8 points to 0.2. Similar shares of the firms reported increases (28 percent) and decreases (27 percent) in sales/revenues. The regional activity index fell 10 points to -18.3, its lowest reading since April.
Firms Report Less Widespread Increases in Full-Time Employment
On balance, the firms reported increases in full-time employment, but the index fell 6 points to 3.5 this month, its lowest reading since June. Almost 23 percent of the firms reported increases, while 19 percent reported decreases; nearly 54 percent of the firms reported no change. The part-time employment index declined from -4.0 to -6.9, its lowest reading since December 2020. Most firms (64 percent) reported steady part-time employment, while the share of firms reporting decreases (14 percent) exceeded the share reporting increases (7 percent). The average workweek index turned positive, rising 6 points to 1.6.
Price Indexes Near Long-Run Averages
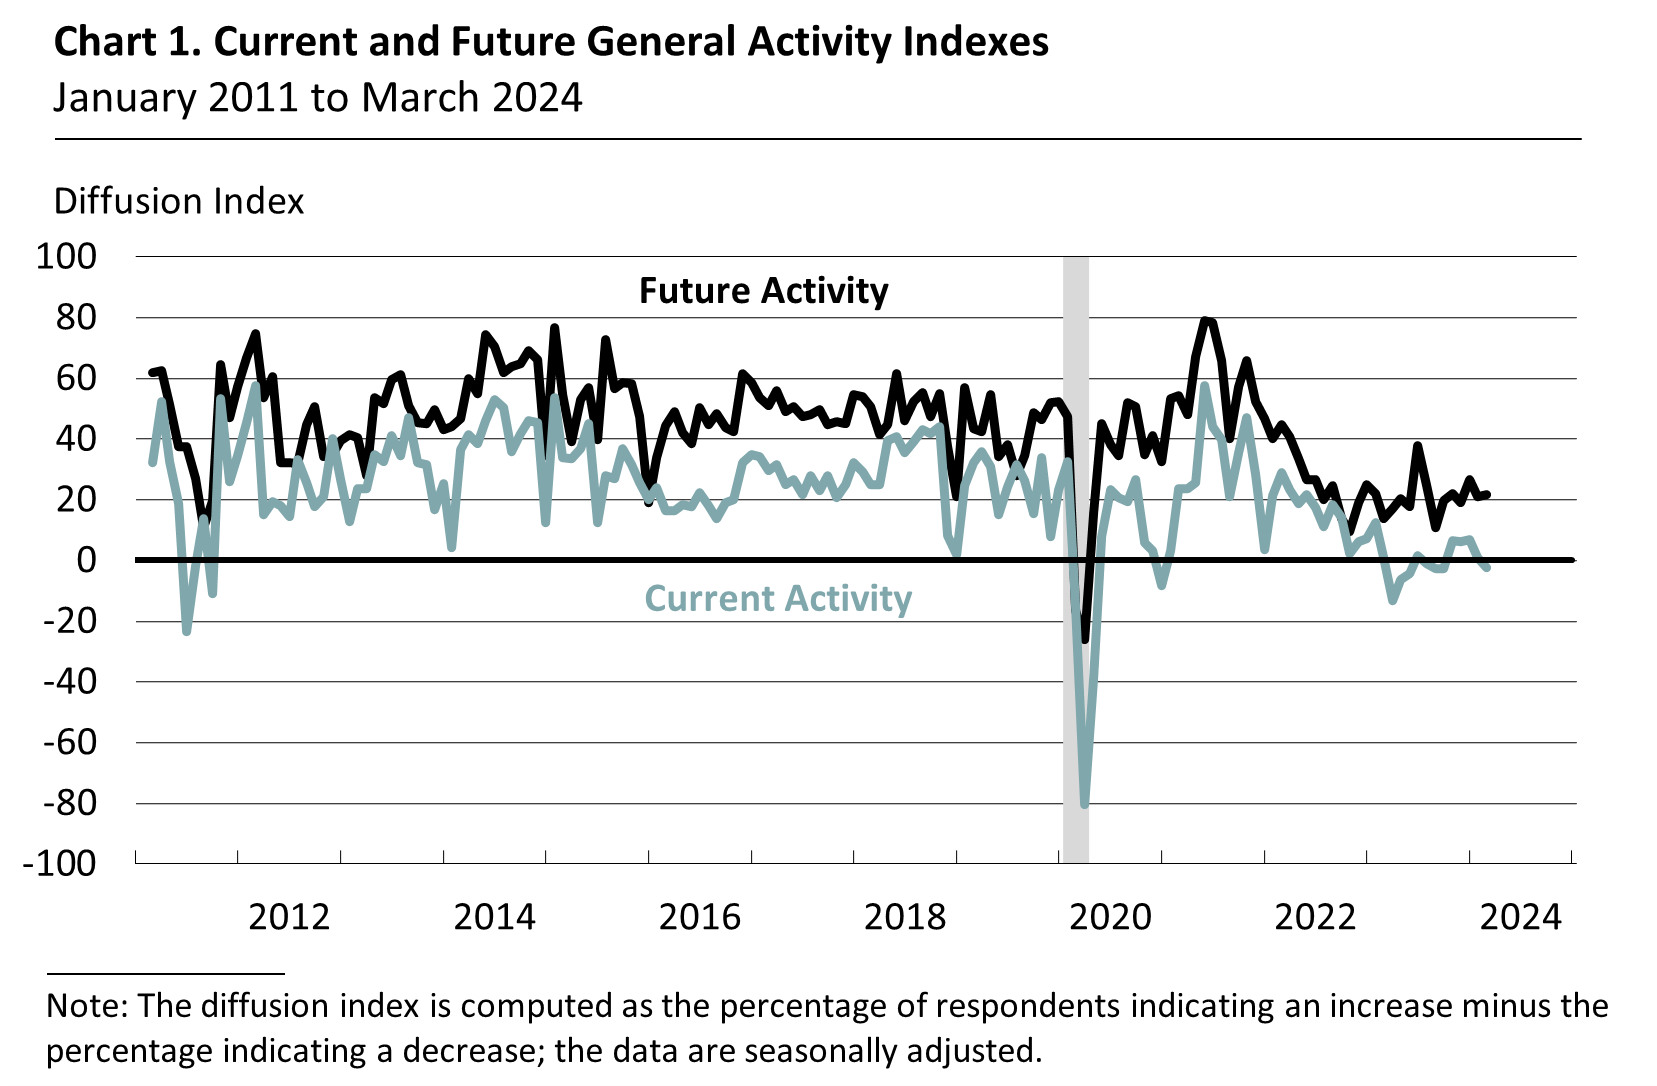
Price indicator readings suggest continued increases in input prices and prices for the firms' own goods and services this month. Both price indexes were near their long-run averages. The prices paid index declined 4 points to 26.6 (see Chart 2). Over 32 percent of the respondents reported higher input prices, while 6 percent reported decreases; 49 percent reported no change. Regarding prices for the firms' own goods and services, the prices received index rose from 2.0 to 16.3, its highest reading since May. More than 26 percent of the firms reported increases in their own prices, while 10 percent reported decreases; 51 percent reported no change.
Firms Report Higher Sales/Revenues
In this month's special questions, the firms were asked to estimate their total sales/revenues growth for the first quarter ending this month compared with the fourth quarter of 2023; they were also asked about factors constraining business operations. The share of firms reporting expected increases in first-quarter sales/revenues (47 percent) was higher than the share reporting decreases (37 percent). Nearly 67 percent of the firms reported labor supply as at least a slight constraint on business operations, down from 74 percent in December. The share of firms indicating financial capital as at least a slight constraint rose in the current quarter, from 53 percent to 61 percent. Over the next three months, most of the firms expect the impacts of various factors to stay the same. However, 21 percent of the firms expect labor supply impacts to worsen, up from 15 percent in December. Conversely, 22 percent of the firms expect financial capital impacts to improve, up from 15 percent in December.
Firms Anticipate Growth
The future general activity indexes continued to suggest firms expect growth over the next six months. The diffusion index for future general activity at the firm level was little changed at 21.7 (see Chart 1). Almost 45 percent of the firms expect an increase in activity at their firms over the next six months, 23 percent expect decreases, and 28 percent of the firms expect no change. The future regional activity index was also little changed at 10.0.
Summary
Responses to this month's Nonmanufacturing Business Outlook Survey suggest a decline in nonmanufacturing activity in the region. The indicators for firm-level general activity and new orders were negative this month, while the sales/revenues index fell to a near-zero reading. The full-time employment index suggests overall increases in employment but declined. The prices paid index declined, while the prices received index rose; both indexes continue to indicate overall price increases. On balance, the firms continue to expect growth over the next six months.
Special Questions (March 2024)
1. How will your firm's total sales/revenues for the first quarter of 2024 compare with that of the fourth quarter of 2023?
| An increase of: |
% of firms |
Subtotals |
| 10% or more |
8.2 |
% of firms reporting an increase: 46.9 |
| 5-10% |
12.2 |
| 0-5% |
26.5 |
| No change |
16.4 |
|
| A decline of: |
|
|
| 0-5% |
10.2 |
% of firms reporting a decrease: 36.7 |
| 5-10% |
4.1 |
| 10% or more |
22.4 |
2. In the current quarter, to what degree have the following factors acted as constraints on business operations?
| |
Not at all
(%)
|
Slightly
(%)
|
Moderately
(%) |
Significantly
(%) |
| COVID-19 mitigation measures |
84.0 |
16.0 |
0.0 |
0.0 |
| Energy markets |
69.6 |
15.2 |
15.2 |
0.0 |
|
Financial capital
|
38.8 |
32.7 |
16.3 |
12.2 |
|
Labor supply
|
33.3 |
50.0 |
8.3 |
8.3 |
| Supply chains |
55.6 |
33.3 |
2.2 |
8.9 |
| Other factors |
64.3 |
17.9 |
10.7 |
7.1 |
3. Over the next three months, how do you expect the impacts of the following factors as constraints on business operations to change?
| |
Worsen
(%)
|
Stay the same
(%)
|
Improve
(%)
|
| COVID-19 mitigation measures |
0.0 |
86.7 |
13.3 |
| Energy markets |
14.9 |
74.5 |
10.6 |
|
Financial capital
|
17.4 |
60.9 |
21.7 |
|
Labor supply
|
21.3 |
66.0 |
12.8 |
| Supply chains |
6.7 |
82.2 |
11.1 |
| Other factors |
7.1 |
89.3 |
3.6 |
Summary of Returns (March 2024)