Firms responding to the November Nonmanufacturing Business Outlook Survey indicated overall improvement in business activity. The indexes for general activity at the firm level and sales/revenues returned to positive territory for the first time since July. The index for new orders rose but remained negative. The firms continued to report higher full- and part-time employment overall, and the prices paid and prices received indexes both indicate overall increases in prices. The respondents continue to expect growth at their own firms over the next six months.
Current Indicators Improve but Are Mixed
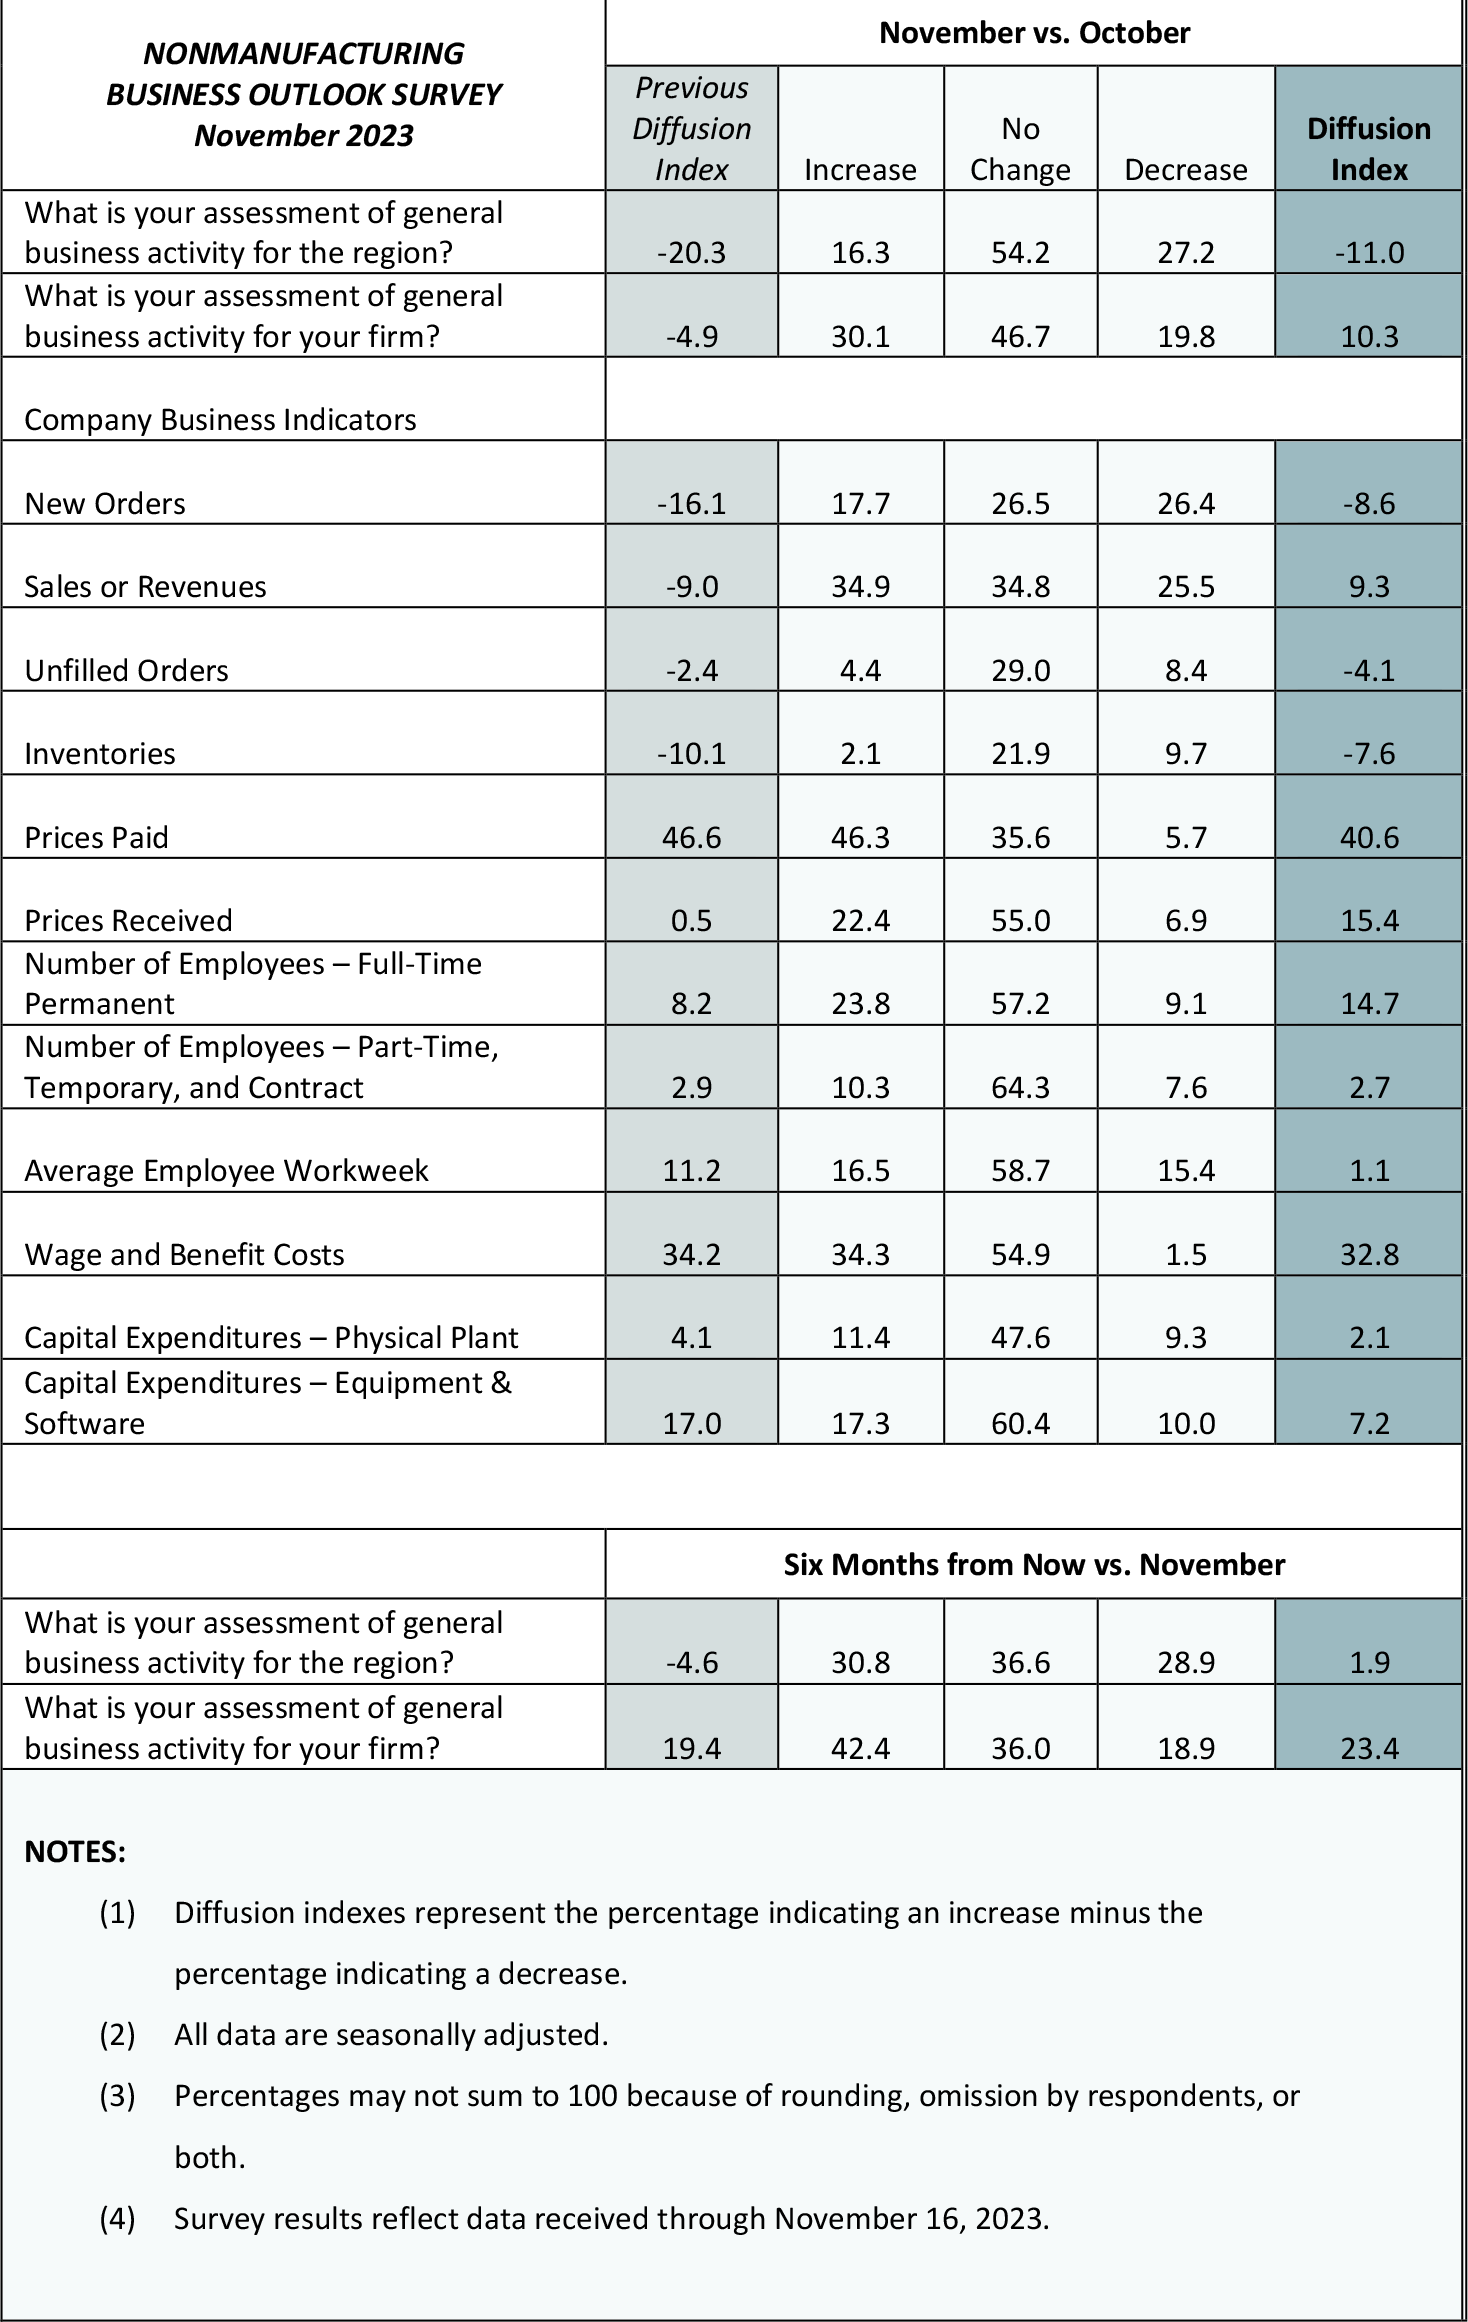
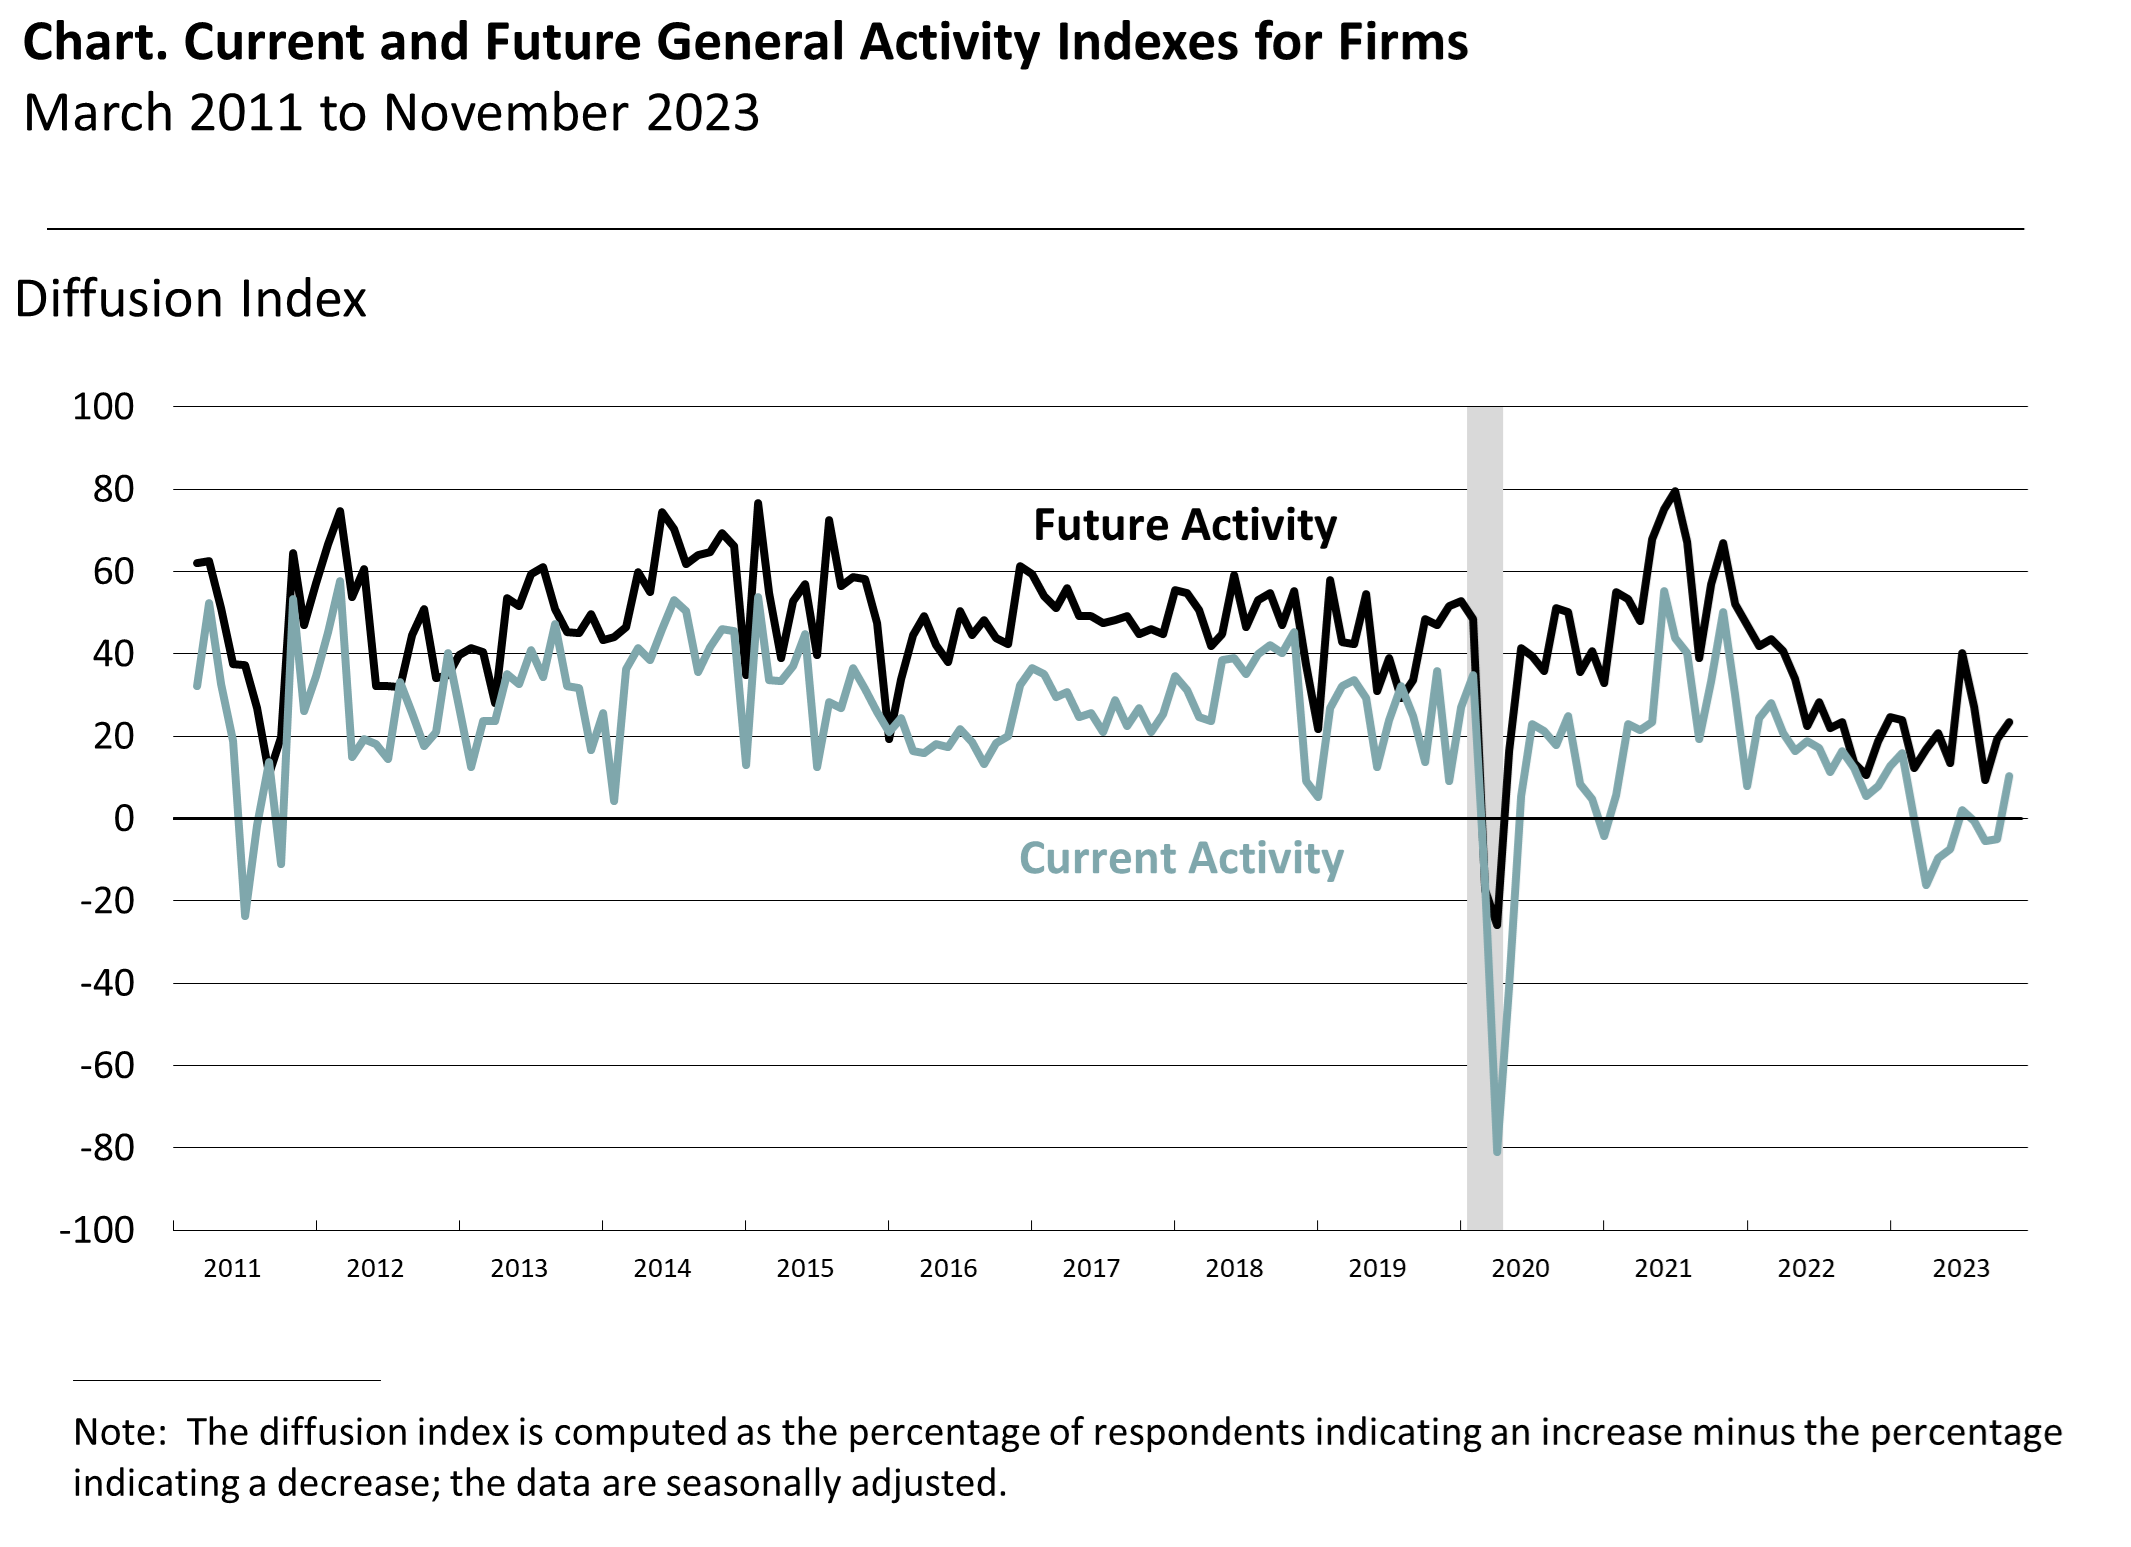
The diffusion index for current general activity at the firm level increased from -4.9 to 10.3, its first positive reading since July (see Chart). Over 30 percent of the firms reported increases in activity (up from 23 percent last month), while 20 percent reported decreases (down from 28 percent). The sales/revenues index improved from -9.0 to 9.3 this month, marking its first positive reading since July. Almost 35 percent of the firms reported increases in sales/revenues (up from 21 percent last month), while 26 percent reported decreases (down from 30 percent). The new orders index rose 8 points but remained negative at -8.6, its sixth consecutive negative reading. Almost 18 percent of the firms reported increases in new orders, while 26 percent reported decreases. The current regional activity index moved up 9 points but remained negative at -11.0.
Firms Report Overall Increases in Employment
Responding firms reported increases in full-time employment this month on balance, and the index increased 7 points to 14.7. The share of firms reporting increases in full-time employment (24 percent) exceeded the share reporting decreases (9 percent); most firms (57 percent) reported no change. The part-time employment index remained mostly steady at 2.7. Most firms (64 percent) reported steady part-time employment, while 10 percent of the firms reported increases and 8 percent reported decreases. The average workweek index fell 10 points to 1.1.
Firms Continue to Report Price Increases
Price indicator readings suggest continued increases in prices for inputs and the firms' own goods and services. The prices paid index fell 6 points to 40.6 this month. More than 46 percent of the firms reported increases in input prices, while 6 percent reported decreases; 36 percent reported stable prices. Regarding prices for the firms' own goods and services, the prices received index rose from 0.5 to 15.4. More than 22 percent of the firms reported higher prices, 7 percent reported lower prices, and 55 percent reported no change.
Firms Expect Own Prices to Rise Slower Than Inflation
In this month's special questions, the firms were asked to
forecast the changes in prices of their own products and for
U.S. consumers over the next four quarters. Regarding their own prices, the firms' median forecast was for an increase of 3.0 percent, down from 4.0 percent when the question was last asked in August. The firms' reported own price change over the past year was 3.0 percent, unchanged from August. The firms expect their employee compensation costs (wages plus benefits on a per employee basis) to rise 4.0 percent over the next four quarters,
unchanged from August. When asked about the rate of inflation for U.S. consumers over the next year, the firms' median forecast was 3.5 percent, down from 4.8 percent in August. The firms' median forecast for the long-run (10-year average) inflation rate was unchanged from August at 3.0 percent.
Firms Anticipate Growth
The future activity indexes suggest firms expect growth at their own companies and in the region over the next six months. The diffusion index for future activity at the firm level rose 4 points to 23.4 this month (see Chart). More than 42 percent of the firms expect increases in future activity at their firms, and 19 percent expect decreases. The future regional activity index rose from -4.6 to 1.9 this month.
Summary
Responses to this month's Nonmanufacturing Business Outlook Survey suggest overall improvement in nonmanufacturing activity in the region. The indicators for firm-level general activity and sales/revenues increased and turned positive, while the new orders index also rose but remained negative this month. The indexes for full- and part-time employment continued to suggest overall increases in employment. Both price indexes continue to indicate overall price increases. Overall, the respondents continue to expect growth at their own firms over the next six months.
Special Questions (November 2023)
|
Please list the annual percent change with respect to the following: |
|
Current
|
Previous
(August 2023)
|
|
For your firm:
|
|
Forecast for next year (2023Q4–2024Q4)
|
|
1. Prices your firm will receive (for its own goods and services sold).
|
3.0 |
4.0 |
|
2. Compensation your firm will pay per employee (for wages and benefits).
|
4.0 |
4.0 |
|
Last year's price change (2022Q4–2023Q4)
|
|
3. Prices your firm did receive (for its own goods and services sold) over the last year.
|
3.0 |
3.0 |
|
For U.S. consumers:
|
|
4. Prices U.S. consumers will pay for goods and services over the next year.
|
3.5 |
4.8 |
|
5. Prices U.S. consumers will pay for goods and services over the next 10 years (2023–2032).
|
3.0 |
3.0 |
|
The numbers represent medians of the individual forecasts (percent changes). For question 5, firms
reported a 10-year annual-average change.
|
Summary of Returns (November 2023)