Nonmanufacturing activity in the region expanded this month, according to the firms responding to the December Nonmanufacturing Business Outlook Survey. The indexes for general activity at the firm level and sales/revenues remained positive, while the new orders index improved but remained negative. The firms continued to report overall increases in full-time employment this month. Both the prices paid and prices received indexes declined but remained positive. The firms continue to expect growth over the next six months at their own firms and in the region.
Current Indexes Remain Mixed
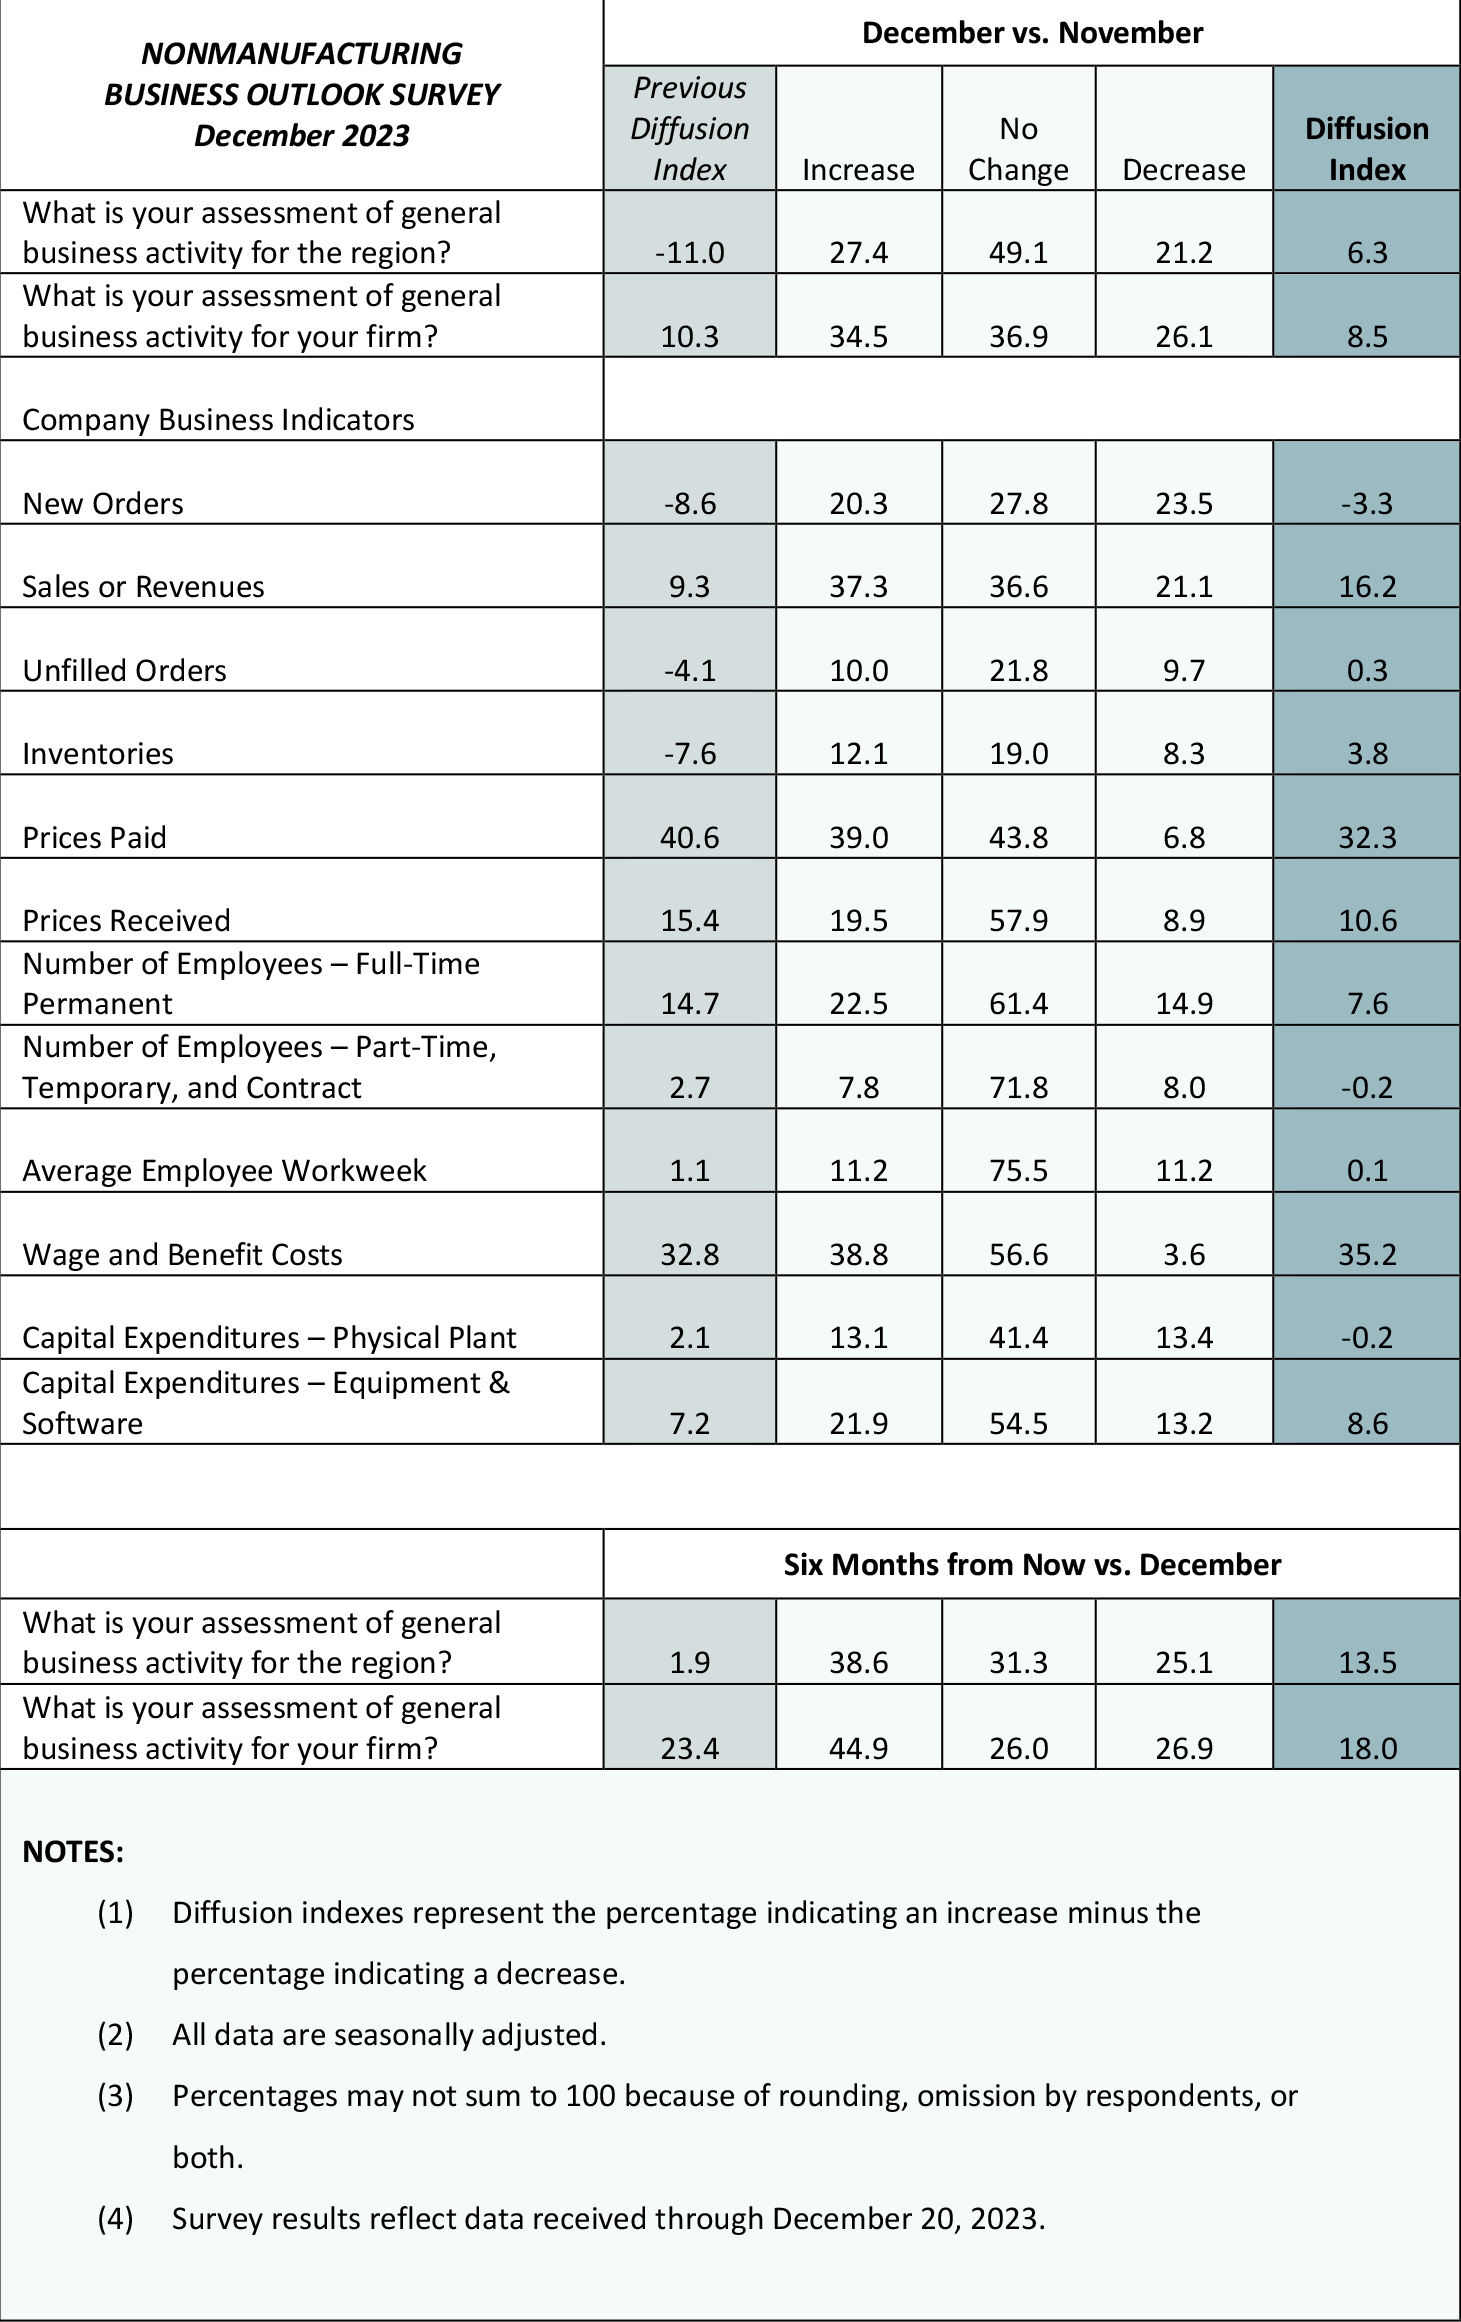
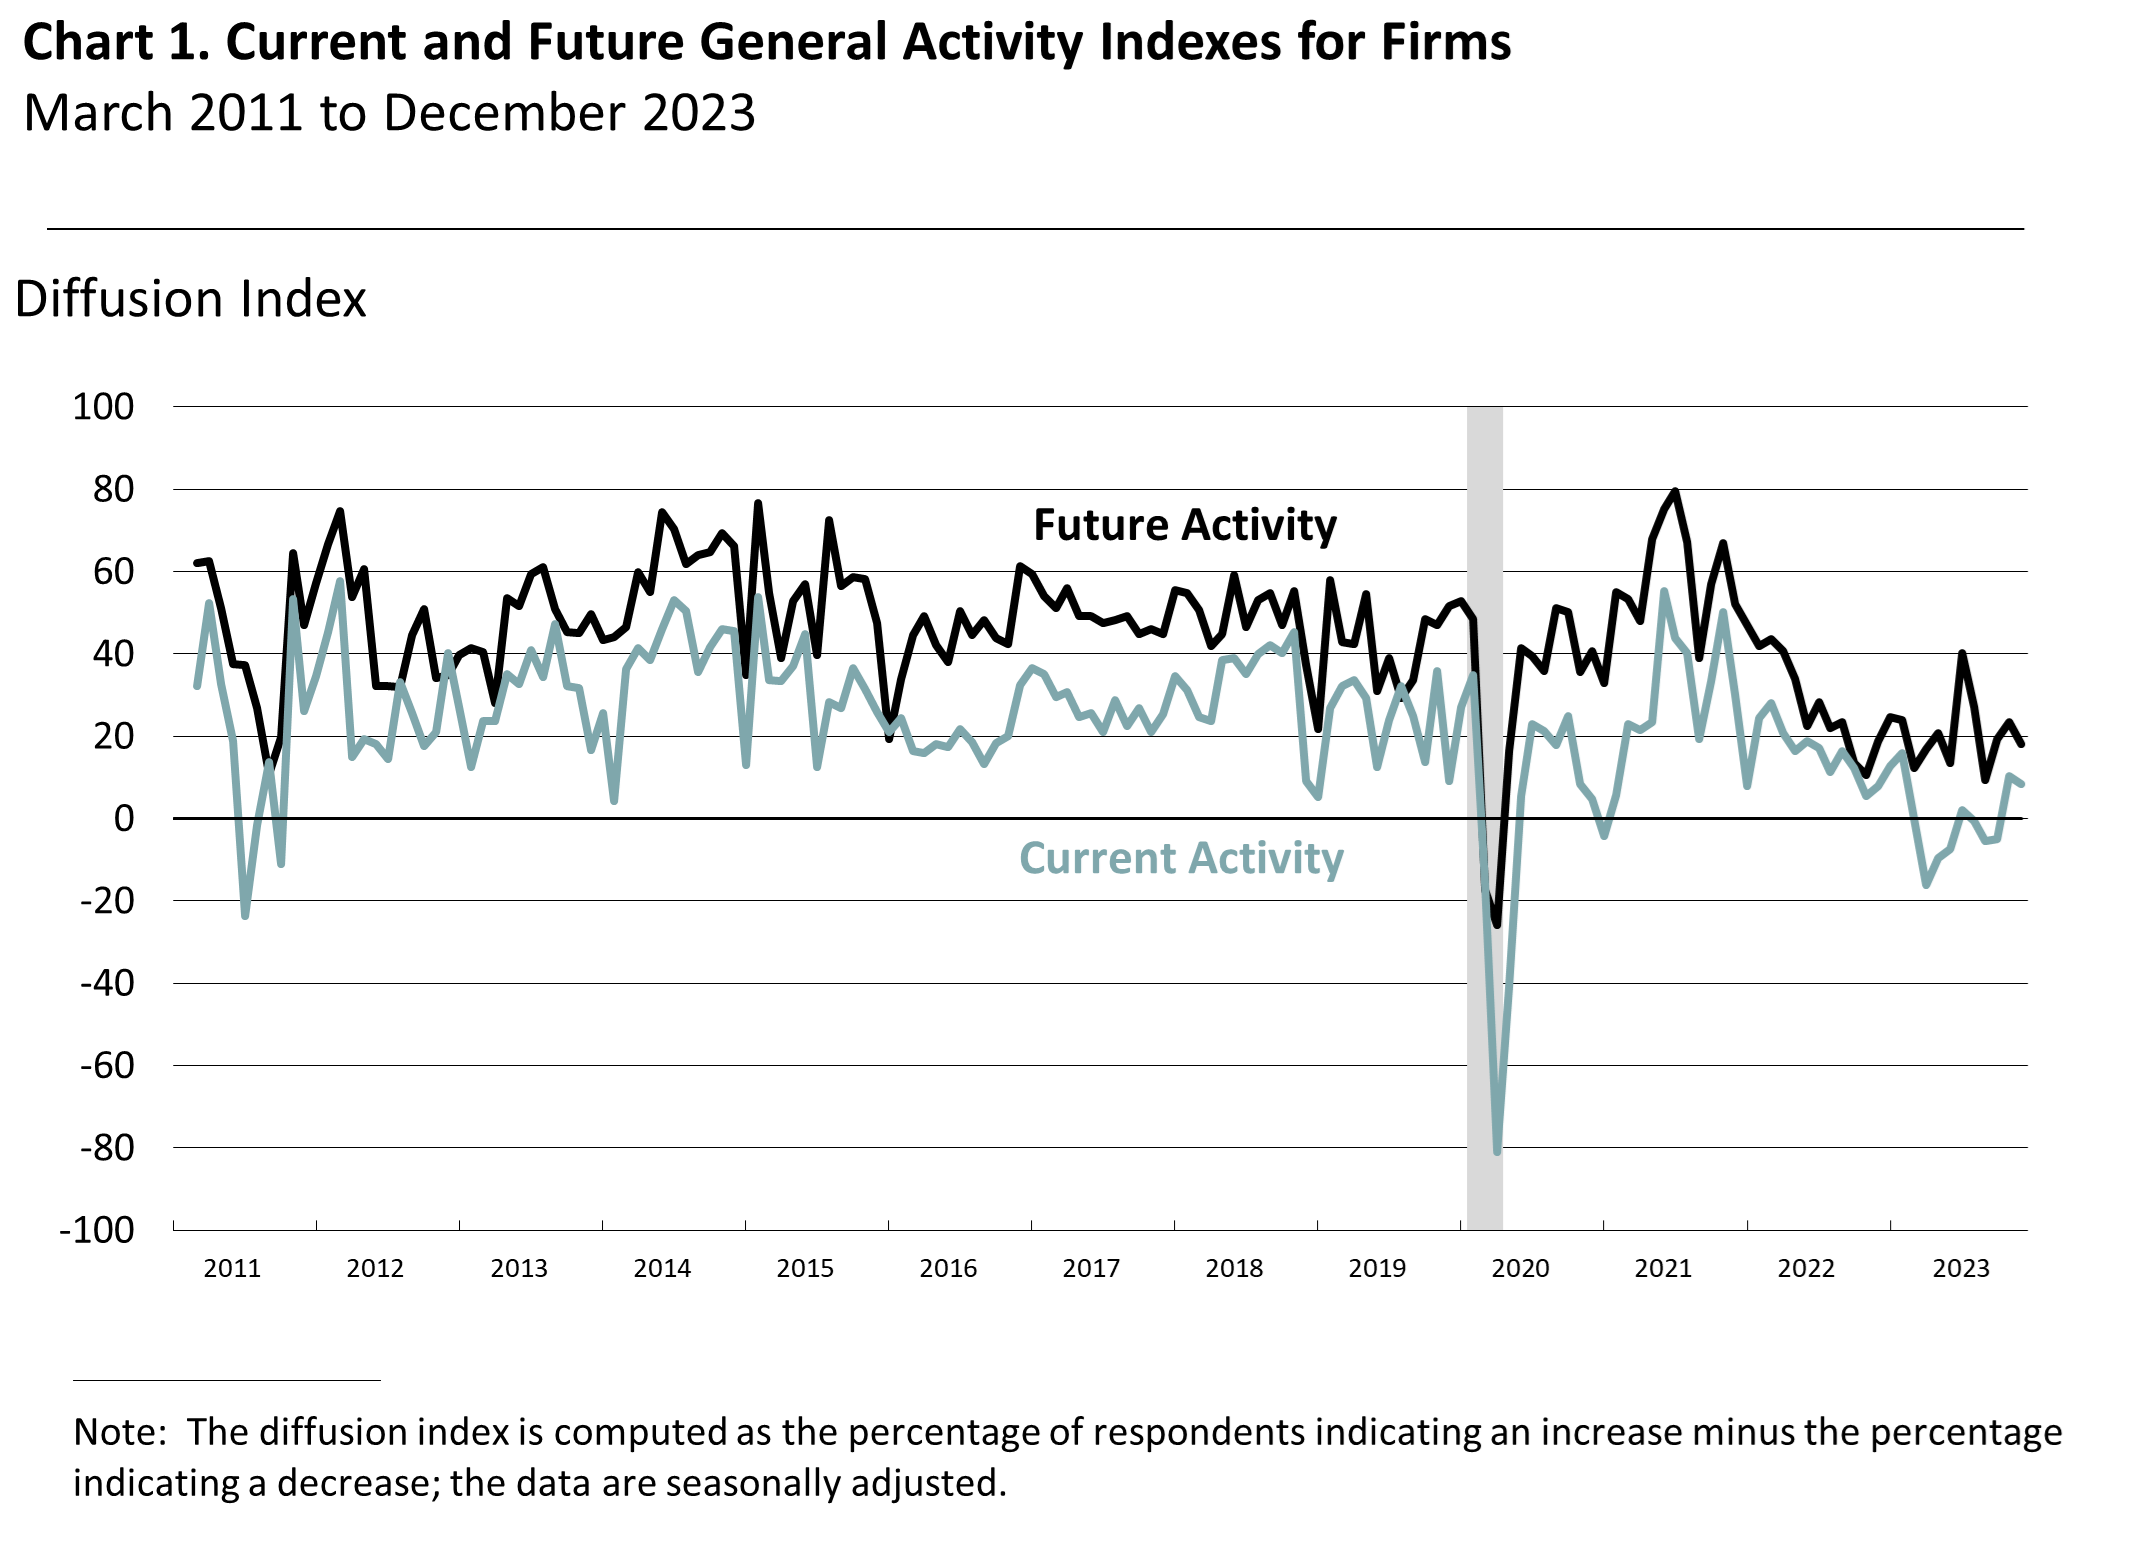
The diffusion index for current general activity at the firm level inched down from a reading of 10.3 in November to 8.5 this month (see Chart 1). Almost 35 percent of the firms reported increases, while 26 percent reported decreases; 37 percent reported no change in activity. The new orders index remained negative but rose from -8.6 to -3.3 this month. More than 20 percent of the firms reported increases in new orders, while 24 percent reported decreases. Meanwhile, the sales/revenues index increased 7 points to 16.2. More than 37 percent of the responding firms reported increases in sales/revenues, while 21 percent reported decreases. The regional activity index rose 17 points to 6.3 this month, its first positive reading since July.
Firms Report Overall Increases in Full-Time Employment
On balance, the firms reported increases in full-time employment, but the index fell 7 points this month, offsetting its increase last month. Almost 23 percent of the firms reported increases, while 15 percent reported decreases; more than 61 percent of the firms reported steady full-time employment levels. The part-time employment index inched down to -0.2.
Firms Continue to Report Price Increases
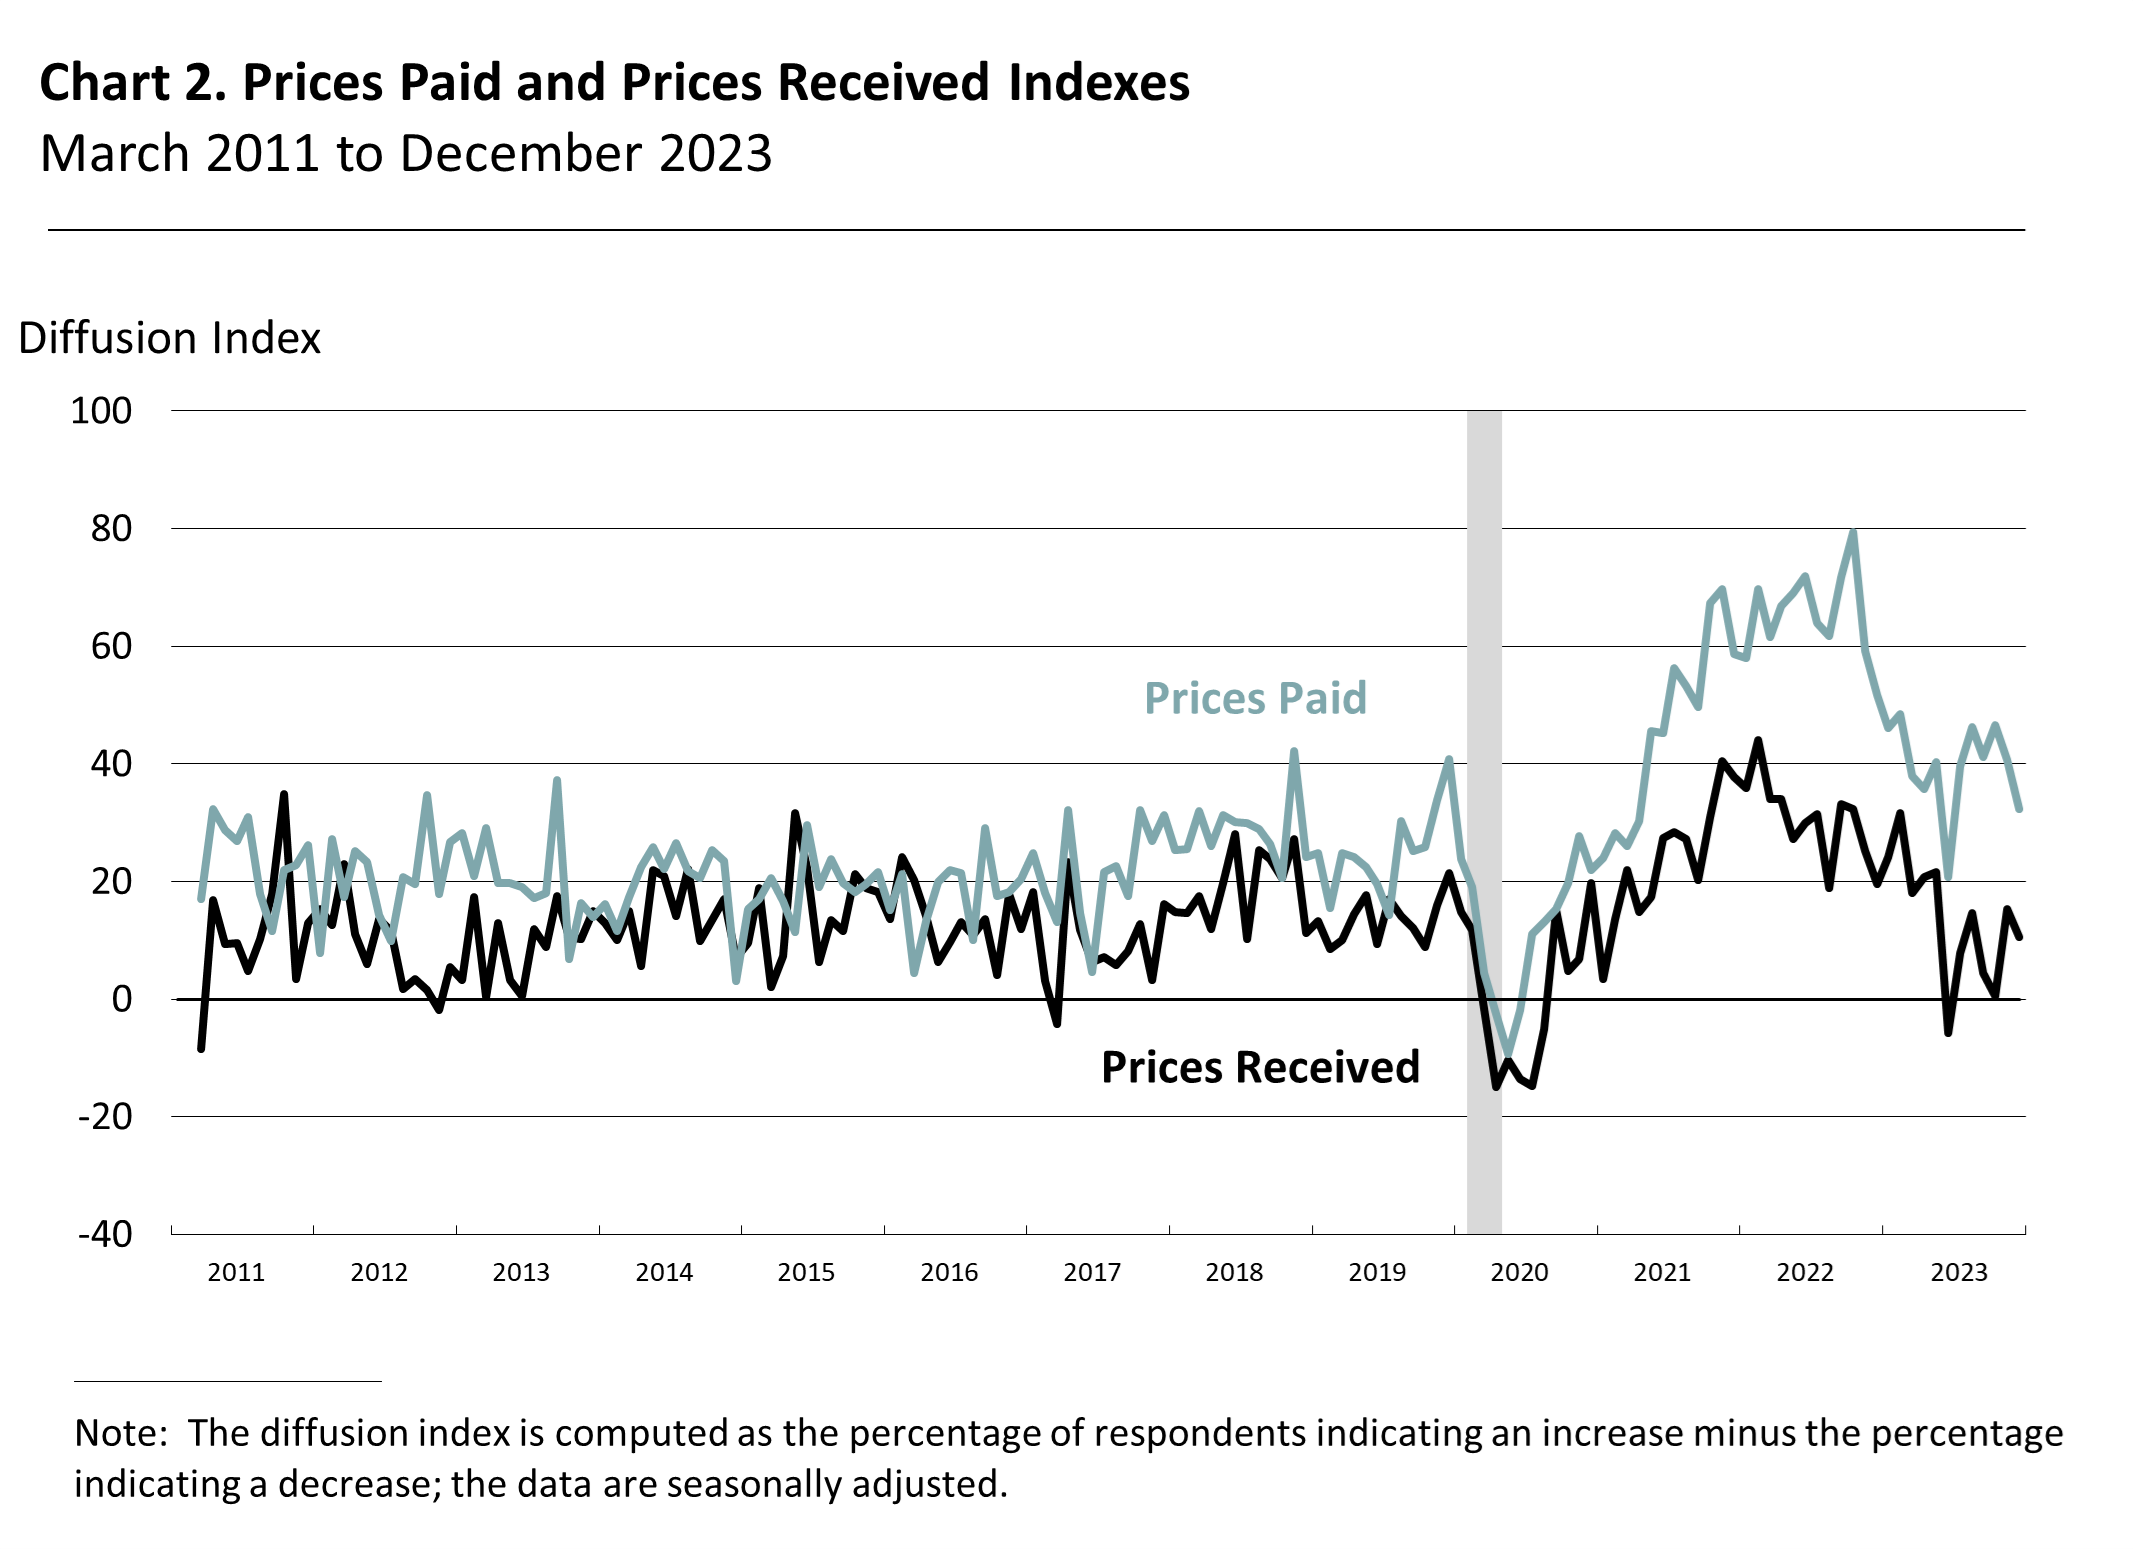
Price indicator readings suggest continued but less widespread increases in prices for inputs and prices for the firms' own goods and services. The prices paid index declined 8 points to 32.3 (see Chart 2). Thirty-nine percent of the respondents reported higher input prices, 44 percent reported no change, and 7 percent reported decreases. Regarding prices for the firms' own goods and services, the prices received index fell from 15.4 to 10.6. Almost 20 percent of the firms reported increases in prices, while 9 percent reported decreases. Most of the firms (58 percent) reported no change in prices for their own goods and services.
Firms Report Higher Sales/Revenues and Easing Constraints
In this month's special questions, the firms were asked to estimate their total sales/revenues growth for the fourth quarter ending this month compared with the third quarter of 2023; they were also asked about factors constraining business operations. The share of firms reporting expected increases in fourth-quarter sales/revenues (48 percent) was higher than the share reporting decreases (36 percent). More than 74 percent of the firms reported labor supply as at least a slight constraint on business operations, down from 80 percent in September. The share indicating supply chains as at least a slight constraint also declined in the current quarter, from 60 percent to 51 percent. Looking ahead over the next three months, most of the firms expect the impacts of various factors to stay the same. In the current quarter, the share of firms reporting financial capital as a significant constraint moved up from 13 percent to 19 percent. However, the share of firms that expect financial capital impacts to worsen over the next three months fell from 45 percent in September to 19 percent in December.
Firms Anticipate Growth
The future firm-level general activity index continued to suggest firms expect growth at their own companies over the next six months. The diffusion index for future general activity at the firm level decreased 5 points to 18.0 (see Chart 1). Almost 45 percent of the firms expect an increase in activity at their firms over the next six months, 27 percent expect decreases, and 26 percent of the firms expect no change. The future regional activity index improved from 1.9 to 13.5.
Summary
Responses to this month's Nonmanufacturing Business Outlook Survey suggest overall increases in nonmanufacturing activity in the region. The indicators for firm-level general activity and sales/revenues were positive this month, while the new orders index improved but remained negative. The full-time employment index suggests overall increases in employment. Both price indexes decreased but continue to indicate overall price increases. Overall, the responding firms expect growth at their own firms and in the region over the next six months.
Special Questions (December 2023)
1. How will your firm's total sales/revenues for the fourth quarter of 2023 compare with that of the third quarter of 2023?
| An increase of: |
% of firms |
Subtotals |
| 10% or more |
16.0 |
% of firms reporting an increase: 48.0 |
| 5-10% |
12.0 |
| 0-5% |
20.0 |
| No change |
16.0 |
|
| A decline of: |
|
|
| 0-5% |
22.0 |
% of firms reporting a decrease: 36.0 |
| 5-10% |
6.0 |
| 10% or more |
8.0 |
2. In the current quarter, to what degree have the following factors acted as constraints on business operations?
| |
Not at all
(%)
|
Slightly
(%)
|
Moderately
(%) |
Significantly
(%) |
| COVID-19 mitigation measures |
90.9 |
7.3 |
1.8 |
0.0 |
| Energy markets |
72.2 |
22.0 |
2.0 |
4.0 |
|
Financial capital
|
47.2 |
20.8 |
13.2 |
18.9 |
|
Labor supply
|
25.9 |
46.3 |
18.5 |
9.3 |
| Supply chains |
49.1 |
39.6 |
7.5 |
3.8 |
| Other factors |
79.3 |
13.8 |
3.4 |
3.4 |
3. Over the next three months, how do you expect the impacts of the following factors as constraints on business operations to change?
| |
Worsen
(%)
|
Stay the same
(%)
|
Improve
(%)
|
| COVID-19 mitigation measures |
13.5 |
76.9 |
9.6 |
| Energy markets |
13.7 |
80.4 |
5.9 |
|
Financial capital
|
18.9 |
66.0 |
15.1 |
|
Labor supply
|
14.5 |
69.1 |
16.4 |
| Supply chains |
3.9 |
80.4 |
15.7 |
| Other factors |
0.0 |
96.7 |
3.3 |
Summary of Returns (December 2023)