Manufacturing activity in the region expanded overall, according to the firms responding to the August Manufacturing Business Outlook Survey. The survey's indicators for general activity, new orders, and shipments were all positive for the first time since May 2022. However, the firms reported a decline in employment, on balance. The price indexes remained near long-run averages. Expectations for growth over the next six months were less widespread, as most of the survey's future indexes remained positive but declined.
Key Current Indicators Turn Positive
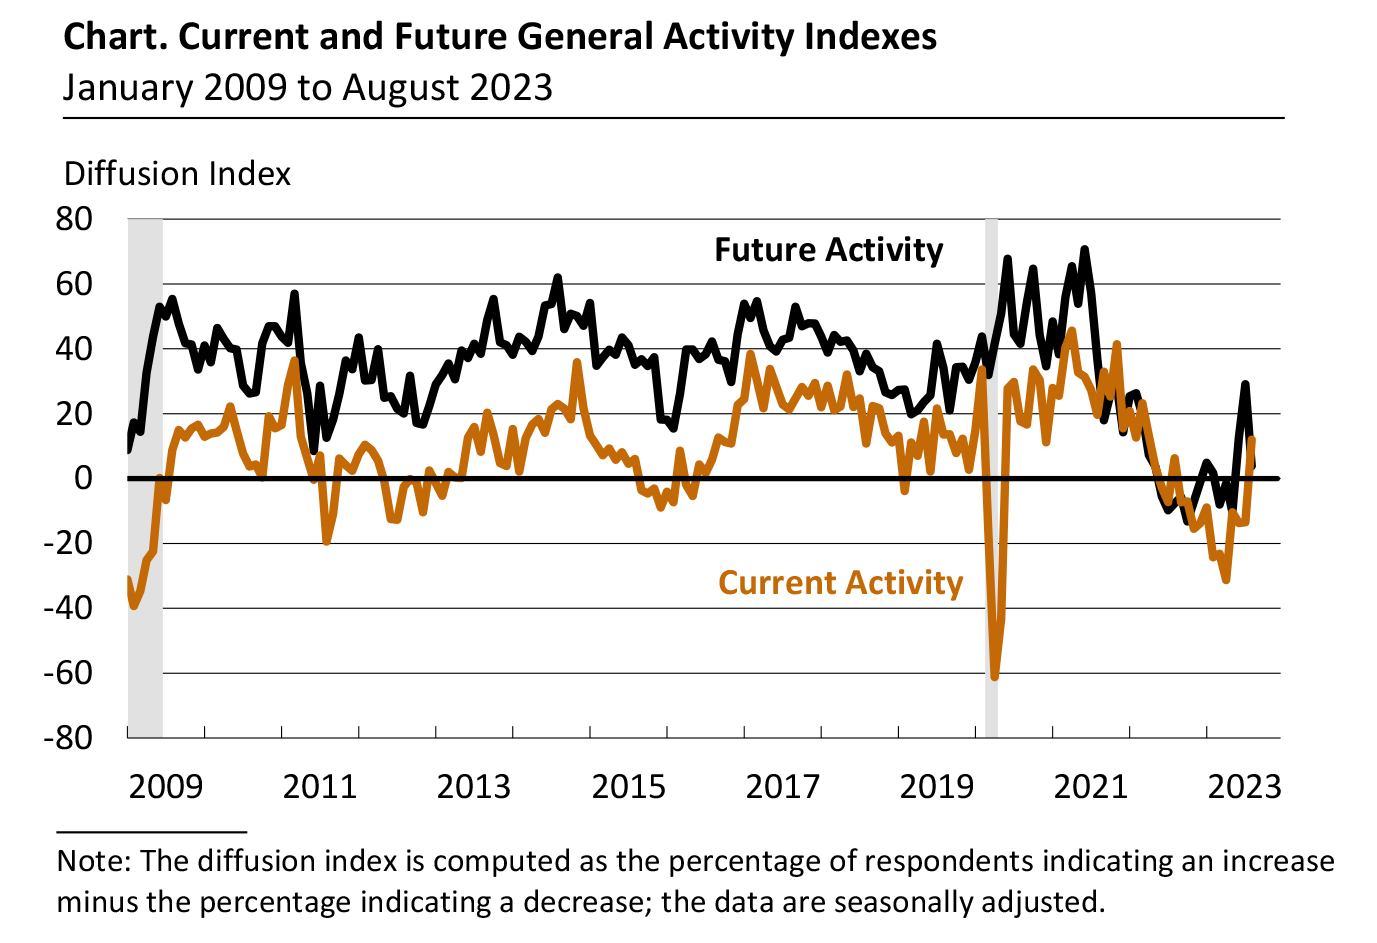
The diffusion index for current general activity rose from a reading of -13.5 last month to 12.0 this month (see Chart), its first positive reading since August 2022. Almost 25 percent of the firms reported increases (up from 17 percent from last month), exceeding the 13 percent reporting decreases (down from 30 percent); 58 percent of the firms reported no change in current activity (up from 49 percent last month). The index for new orders – which had been negative for 14 consecutive months – climbed 32 points to 16.0, and the shipments index rose 18 points to 5.7.
On balance, the firms reported a decline in employment, and the employment index moved down 5 points to -6.0. Over 18 percent of the firms reported a decrease in employment, compared with 12 percent that reported an increase; most firms (70 percent) reported no change. The average workweek index rose 9 points to 6.3.
Price Indexes Remain Near Long-Run Averages
On balance, the firms reported overall increases in prices, but both price indexes remain near their long-run averages. The prices paid diffusion index rose 11 points to 20.8. More than 27 percent of the firms reported increases in input prices, while 6 percent reported decreases; 66 percent reported no change. The current prices received index decreased 9 points to 14.1. More than 27 percent of the firms reported increases in the prices of their own goods, 13 percent reported decreases, and 59 percent reported no change.
Firms Expect Lower Increases in Prices from Last Quarter
In this month's special questions, the firms were asked to forecast the changes in prices of their own products and for U.S. consumers over the next four quarters. Regarding their own prices over the next year, the firms' median forecast was for an expected increase of 4.0 percent, down from 4.5 percent when this question was last asked in May. The firms reported a median increase of 5.0 percent in their own prices over the past year, down from 6.0 percent last quarter. The firms' median forecast for the rate of inflation for U.S. consumers over the next year was 4.0 percent, down from 5.0 percent in May. Over the long run, the firms' median forecast for the 10-year average inflation rate was 3.5 percent, up slightly from 3.3 percent.
Future Indicators Soften
The diffusion index for future general activity dropped 25 points to 3.9, its lowest reading since May (see Chart). Almost 27 percent of the firms expect an increase in activity over the next six months, slightly exceeding the 23 percent that expect a decrease. The future new orders and shipments indexes also declined. The future new orders index fell from 38.2 to 18.2, and the future shipments index decreased from 37.3 to 14.9. The firms continue to expect increases in employment overall, but the future employment index declined 9 points to 12.0. Both future price indexes rose to readings above their long-run averages. The future capital expenditures index fell 13 points to -4.5, its first negative reading since April.
Summary
Responses to the August Manufacturing Business Outlook Survey suggest overall expansion in the region's manufacturing sector this month. The indicators for current activity, new orders, and shipments rose into positive territory. The firms continued to indicate overall increases in prices and an overall decline in employment. The survey's future indexes suggest less widespread expectations for growth over the next six months.
Special Questions (August 2023)
|
Please list the annual percent change with respect to the following: |
|
Current
|
Previous
(May 2023)
|
|
For your firm:
|
|
Forecast for next year (2023Q3–2024Q3)
|
|
1. Prices your firm will receive (for its own goods and services sold).
|
4.0 |
4.5 |
|
2. Compensation your firm will pay per employee (for wages and benefits).
|
4.0 |
4.0 |
|
Last year's price change (2022Q3–2023Q3)
|
|
3. Prices your firm did receive (for its own goods and services sold) over the last year.
|
5.0 |
6.0 |
|
For U.S. consumers:
|
|
4. Prices U.S. consumers will pay for goods and services over the next year.
|
4.0 |
5.0 |
|
5. Prices U.S. consumers will pay for goods and services over the next 10 years (2023–2032).
|
3.5 |
3.3 |
|
The numbers represent medians of the individual forecasts (percent changes). For question 5, firms reported a 10-year annual-average change.
|