Manufacturing activity in the region declined overall, according to the firms responding to the September Manufacturing Business Outlook Survey. The survey's indicators for general activity, new orders, and shipments returned to negative territory after turning positive in August. On balance, the firms continued to report a decline in employment. The price indexes remained near long-run averages. Most future activity indicators improved, suggesting more widespread expectations for overall growth over the next six months.
Key Current Indicators Turn Negative
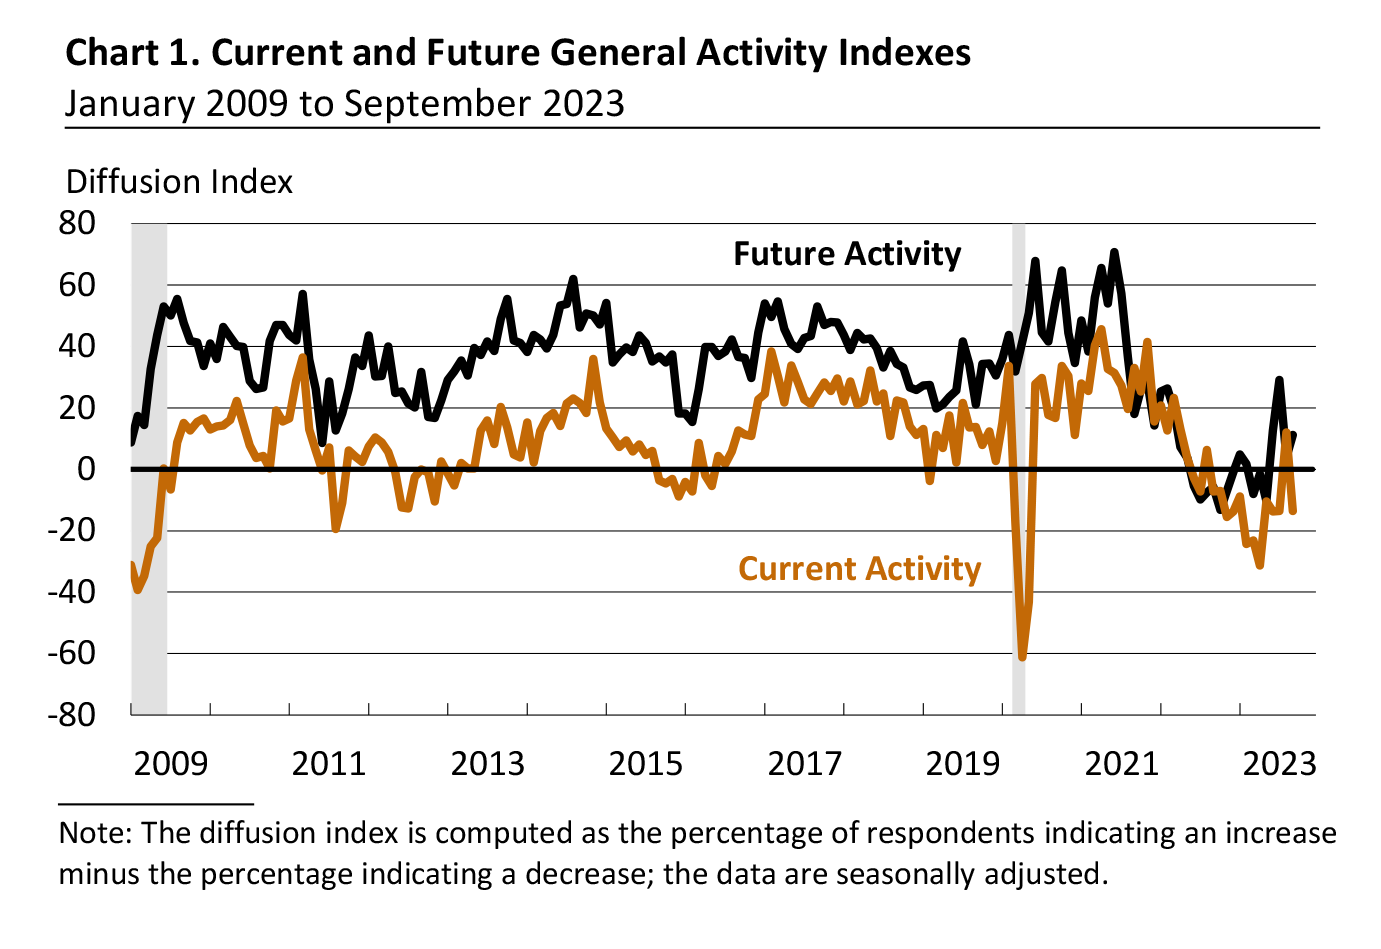
The diffusion index for current general activity returned to negative territory, falling from 12.0 in August to -13.5 in September (see Chart 1). This is the index's 14th negative reading in the past 16 months. More than 29 percent of the firms reported decreases (up from 13 percent last month), exceeding the 16 percent reporting increases (down from 25 percent); 55 percent of the firms reported no change in current activity (down from 58 percent last month). The indicators for new orders and shipments also declined. The new orders index – which had been negative for 14 consecutive months prior to August – dropped from 16.0 last month to -10.2 this month. The shipments index declined 9 points to -3.2 in September.
On balance, the firms continued to report a decline in employment, with the index little changed at -5.7. Over 19 percent of the firms reported a decrease in employment, compared with 14 percent that reported an increase; most firms (67 percent) reported no change. The average workweek index edged down from 6.3 to 4.7.
Price Indexes Remain Near Long-Run Averages
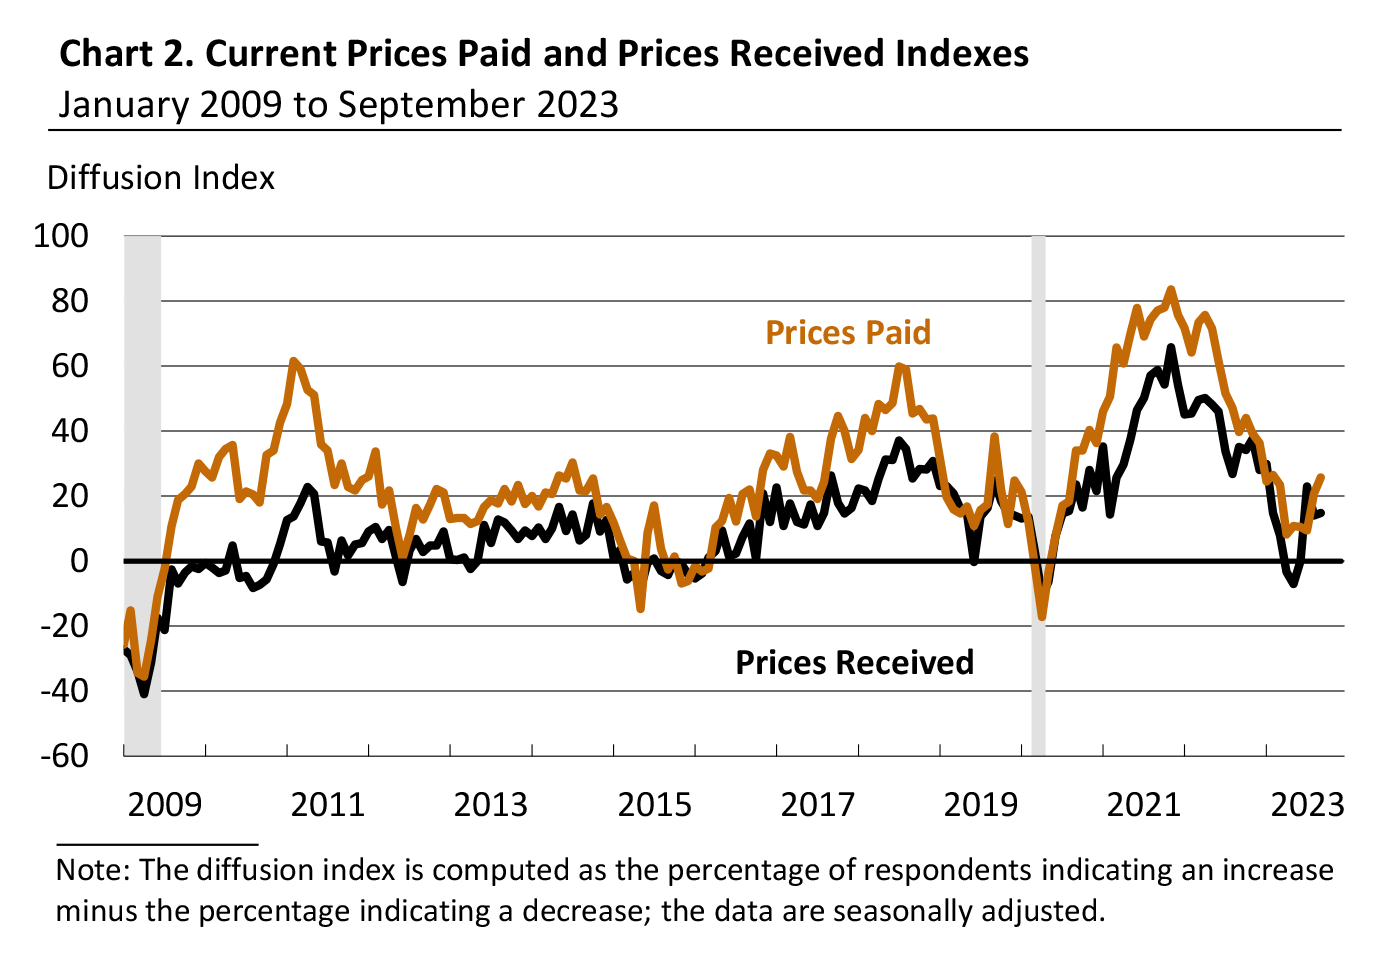
On balance, the firms reported overall increases in prices. However, most firms reported no change in prices, and both price indexes remained near their long-run averages. The prices paid diffusion index rose 5 points to 25.7 in September (see Chart 2). More than 26 percent of the firms reported increases in input prices, while less than 1 percent reported decreases; 73 percent reported no change. The current prices received index was little changed at 14.8 in September. Nearly 25 percent of the firms reported increases in the prices of their own goods, 10 percent reported decreases, and 65 percent reported no change.
Firms Report Little Change in Production and Capacity Utilization
In this month's special questions, the firms were asked to estimate their total production growth for the third quarter ending this month compared with the second quarter of 2023. The share of firms reporting an increase in production was the same as the share reporting a decrease (37 percent). Regarding firms' capacity utilization rate for the current quarter and one year ago, the median current capacity utilization rate reported among the responding firms was unchanged at 70 to 80 percent.
Although a plurality of firms reported labor supply as a slight or moderate constraint to capacity utilization, 34 percent indicated labor was not at all a constraint; one-fifth of the firms reported labor was a significant constraint. Nearly 46 percent of the firms reported supply chains were not a constraint to capacity utilization, up from 27 percent when this question was asked in June. Looking ahead over the next three months, most firms expect the impacts of various factors to stay the same. However, 22 percent of the firms expect the impacts of COVID-19 mitigation measures to worsen, up from zero percent in June. Additionally, 24 percent of the firms expect the impacts of energy markets to worsen, while over one-fifth of the firms expect the impacts of financial capital to worsen.
Future Indicators Rise
The diffusion index for future general activity rose from a reading of 3.9 in August to 11.1 in September (see Chart 1). Nearly 30 percent of the firms expect an increase in activity over the next six months, exceeding the 19 percent that expect a decrease; 45 percent expect no change. The future new orders and future shipments indexes rose to near their long-run averages. The future new orders index increased 7 points to 25.6, and the future shipments index rose 16 points to 30.5. On balance, the firms continued to expect increases in employment over the next six months, but the future employment index declined from a reading of 12.0 to 6.5. Both future price indexes declined but remained somewhat above their long-run averages. The future capital expenditures index rose 12 points to 7.5.
Summary
Responses to the September Manufacturing Business Outlook Survey suggest overall declines in the region's manufacturing sector. The indicators for current activity, new orders, and shipments all declined into negative territory. The firms continued to report overall increases in prices and an overall decline in employment. The survey's future indexes improved, suggesting more widespread expectations for growth over the next six months.
Special Questions (September 2023)
1. How will your firm's total production for the third quarter of 2023
compare with that of the second quarter of 2023?
| An increase of: |
% of firms |
Subtotals |
| 10% or more |
20.0 |
% of firms reporting an increase: 37.2 |
| 5-10% |
8.6 |
| 0-5% |
8.6 |
| No change |
25.7 |
|
| A decline of: |
|
|
| 0-5% |
17.1 |
% of firms reporting a decrease: 37.1 |
| 5-10% |
11.4 |
| 10% or more |
8.6 |
2. Which of the following best characterizes your plant's percentage capacity utilization currently
(2023:Q3) and one year ago (2022:Q3)?
Capacity Utilization Rate |
2023:Q3
% of Reporters |
2022:Q3
% of Reporters |
| Less than 30% |
0.0 |
0.0 |
| 30-40% |
5.7 |
2.9 |
| 40-50% |
5.7 |
2.9 |
| 50-60% |
0.0 |
2.9 |
| 60-70% |
28.6 |
20.0 |
| 70-80% |
40.0 |
31.4 |
| 80-90% |
14.3 |
22.9 |
| 90-100% |
5.7 |
17.1 |
| Median Utilization Rate |
70-80 |
70-80 |
3. In the current quarter, to what degree have the following factors acted as constraints on capacity utilization?
| |
Not at all
(%)
|
Slightly
(%)
|
Moderately
(%) |
Significantly
(%) |
| COVID-19 mitigation measures |
100.0 |
0.0 |
0.0 |
0.0 |
| Energy markets |
85.3 |
5.9 |
8.8 |
0.0 |
| Financial capital
|
82.4 |
2.9 |
11.8 |
2.9 |
|
Labor supply
|
34.3 |
17.1 |
28.6 |
20.0 |
| Supply chains |
45.7 |
17.1 |
22.9 |
14.3 |
| Other factors |
75.0 |
4.2 |
8.3 |
12.5 |
4. Over the next three months, how do you expect the impacts of the following factors as constraints on capacity utilization to change?
| |
Worsen
(%)
|
Stay the same
(%)
|
Improve
(%)
|
| COVID-19 mitigation measures |
21.9 |
75.0 |
3.1 |
| Energy markets |
24.2 |
75.8 |
0.0 |
|
Financial capital
|
21.2 |
78.8 |
0.0 |
|
Labor supply
|
14.3 |
74.3 |
11.4 |
| Supply chains |
5.7 |
77.1 |
17.1 |
| Other factors |
15.4 |
84.6 |
0.0 |