Manufacturing activity in the region continued to decline overall, according to the firms responding to the July Manufacturing Business Outlook Survey. The survey's indicators for general activity and new orders remained negative. Furthermore, the index for shipments declined and turned negative. The employment index suggests mostly steady employment overall. The prices paid index remained below its long-run average, while the prices received index rose. Most future indicators improved, suggesting more widespread expectations for overall growth over the next six months.
Current Indicators Remain Weak
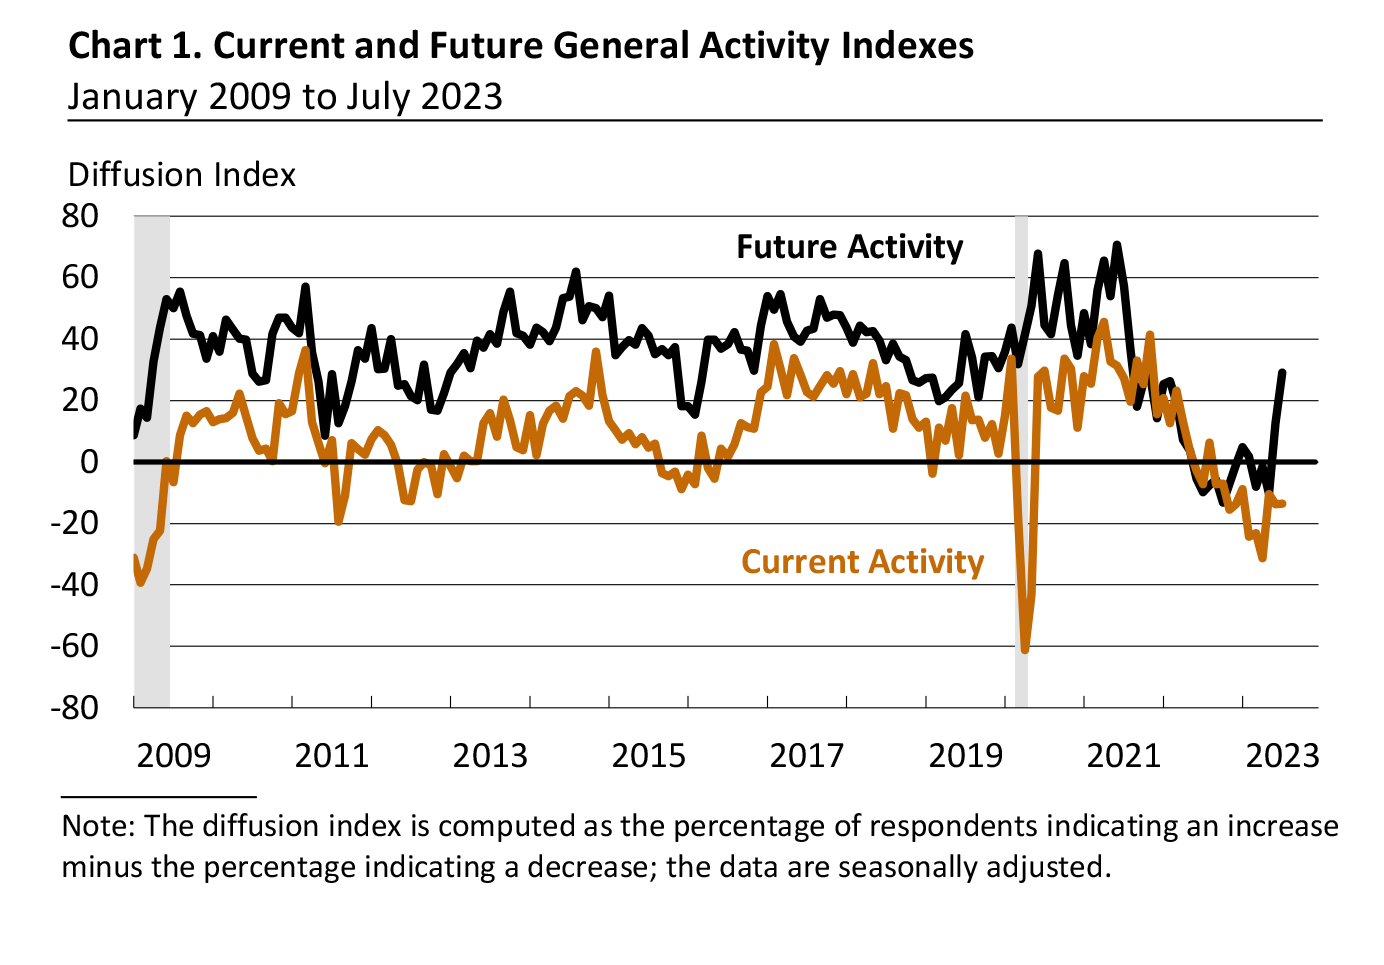
The diffusion index for current general activity was little changed at a reading of -13.5 this month (see Chart 1), its 11th consecutive negative reading. More than 30 percent of the firms reported decreases, exceeding the 17 percent reporting increases; 49 percent of the firms reported no change in current activity. The index for new orders declined 5 points to -15.9, the index's 14th consecutive negative reading. The current shipments index dropped sharply from 9.9 last month to -12.5 this month. More than 29 percent of the firms reported decreases in shipments (up from 21 percent last month), compared with 17 percent that reported increases (down from 31 percent); 51 percent reported no change (up from 45 percent).
On balance, the firms reported mostly steady levels of employment. The employment index ticked down from a reading of -0.4 last month to -1.0 this month. Similar shares of the firms reported decreases (14 percent) and increases in employment (13 percent); most firms (72 percent) reported no change. The average workweek index rose from -8.2 to ‑3.0.
Prices Paid Index Remains Below Long-Run Average,
Prices Received Index Rises
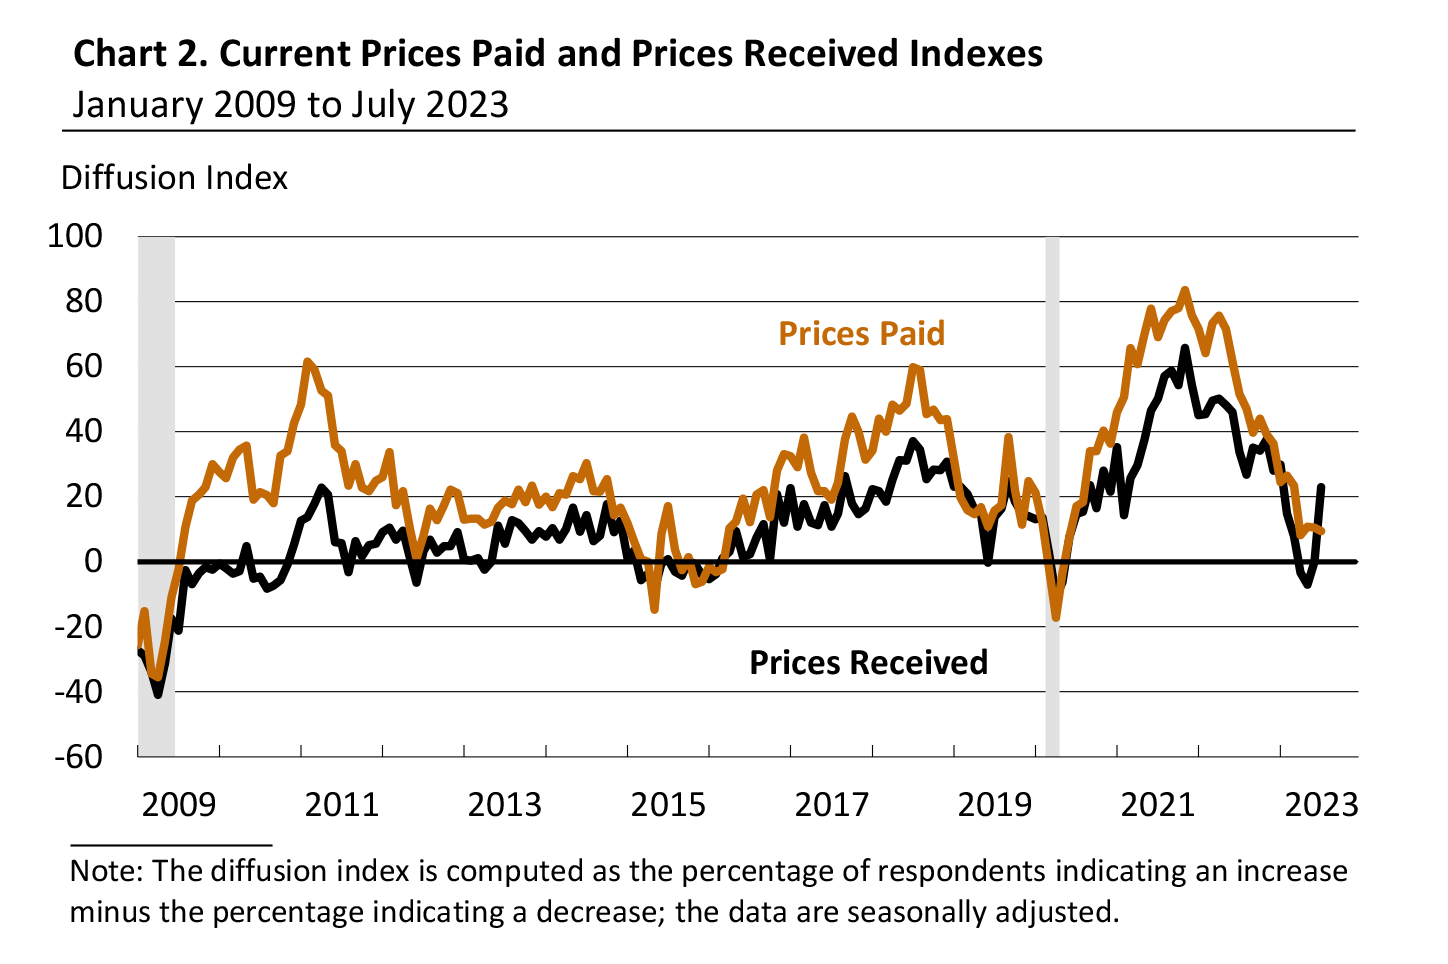
The prices paid diffusion index declined 1 point to 9.5 in July (see Chart 2). One-fifth of the firms reported increases in input prices, and 11 percent reported decreases; 68 percent reported no change. On balance, the firms reported increases in the prices of their own goods. The current prices received index climbed from a near-zero reading in June to 23.0 in July, the index's highest reading since January. Nearly 29 percent of the firms reported increases, 6 percent reported decreases, and 63 percent reported no change.
Firms Continue to Expect Increases for Wages
In this month's special questions, the firms were asked about changes in wages and compensation over the past three months, as well as their updated expectations for changes in various input and labor costs for the current year. Nearly 58 percent of the firms indicated wages and compensation costs had increased over the past three months, 43 percent reported no change, and none reported decreases. Most firms (60 percent) reported not needing to adjust their 2023 budgets for wages and compensation since the beginning of the year; however, 30 percent noted they are planning to increase wages and compensation by more than originally planned, and 15 percent noted they are planning to increase wages and compensation sooner than originally planned.
The firms still expect cost increases across all categories of expenses in 2023, and the median expected increases were in line with or slightly lower than expectations for most categories when this question was last asked in April. Responses indicate a median expected increase of 3 to 4 percent for wages and of 4 to 5 percent for total compensation (wages plus benefits), both unchanged from April.
Future Indicators Rise to Long-Run Averages
The diffusion index for future general activity jumped from a reading of 12.7 in June to 29.1 in July, the index's highest reading since August 2021 (see Chart 1). Nearly 40 percent of the firms expect an increase in activity over the next six months (up from 33 percent last month), and 11 percent expect a decrease (down from 20 percent); 46 percent expect no change (up from 44 percent). The future new orders index climbed 24 points to 38.2, while the future shipments index rose 9 points to 37.3. On balance, the firms continued to expect increases in employment over the next six months, and the future employment index increased from a reading of 13.1 to 21.3. The future price indexes suggest that firms expect price increases over the next six months, but both indexes remained below their long-run averages. The future capital expenditures index ticked down from 9.9 to 8.6.
Summary
Responses to the July Manufacturing Business Outlook Survey suggest continued overall declines in the region's manufacturing sector this month. The indicators for current activity and new orders remained negative, while the index for shipments turned negative. The firms reported overall increases in prices received and prices paid. The survey's future indexes improved and suggest that respondents expect growth over the next six months.
Special Questions (July 2023)
1. How have wages and compensation changed at your firm over the past three months?
|
Percent (%) |
| Increased |
57.5 |
| No change |
42.5 |
| Decreased |
0.0 |
2. Since the beginning of the year, have you adjusted your budget for wages and compensation for 2023?*
|
Percent (%) |
| Yes, and we are planning to increase wages and compensation by more than originally planned. |
30.0 |
| Yes, and we are planning to increase wages and compensation sooner than originally planned. |
15.0 |
| No, we have not needed to make adjustments. |
60.0 |
| Other |
2.5 |
| *Percentages do not sum to 100 because more than one option could be selected. |
3. What percentage change in costs do you now expect for the following categories over all of 2023?**
| |
Energy
(%)
|
Other Raw Materials
(%)
|
Intermediate Goods
(%)
|
Wages
(%)
|
Health Benefits
(%)
|
Nonhealth Benefits
(%)
|
Wages + Health Benefits + Nonhealth Benefits (%) |
|
Decline of more than 1%
|
5.3 |
18.4 |
0.0 |
0.0 |
5.3 |
0.0 |
2.7 |
|
No change
|
28.9 |
21.1 |
30.6 |
2.6 |
15.8 |
42.1 |
5.4 |
|
Increase of 1–2%
|
15.8 |
7.9 |
2.8 |
5.3 |
5.3 |
10.5 |
5.4 |
|
Increase of 2–3%
|
7.9 |
18.4 |
27.8 |
15.8 |
2.6 |
13.2 |
10.8 |
|
Increase of 3–4%
|
10.5 |
5.3 |
5.6 |
34.2 |
15.8 |
13.2 |
16.2 |
|
Increase of 4–5%
|
7.9 |
7.9 |
19.4 |
28.9 |
18.4 |
13.2 |
18.9 |
|
Increase of 5–7.5%
|
5.3 |
13.2 |
8.3 |
5.3 |
15.8 |
5.3 |
18.9 |
|
Increase of 7.5–10%
|
5.3 |
5.3 |
2.8 |
5.3 |
10.5 |
2.6 |
13.5 |
|
Increase of 10–12.5%
|
2.6 |
2.6 |
0.0 |
2.6 |
5.3 |
0.0 |
8.1 |
|
Increase of more than 12.5%
|
0.0 |
0.0 |
2.8 |
0.0 |
2.6 |
0.0 |
0.0 |
|
Median Expected Change |
1–3% |
2–3% |
2–3% |
3–4% |
4–5% |
1–2% |
4–5% |
|
Median Expected Change (April 2023) |
3–4% |
2–3% |
3–4% |
3–4% |
3–4% |
2–3% |
4–5% |
| **The firms responded to more detailed changes than shown in the provided ranges. |